

Open Window → Worksheets to review objects and assembly sheets in lists, edit selected values, and export tables. The visible views depend on the active workspace:
Depending on the view, you can filter and sort information and change certain values. The sections for each list identify the fields you can edit and their scope.
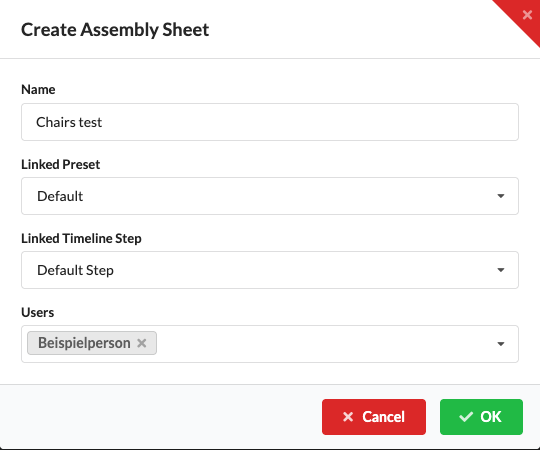
The example data in the current UI captures comes from the replaced drawings, including the assembly sheet Chairs test : Default Step.
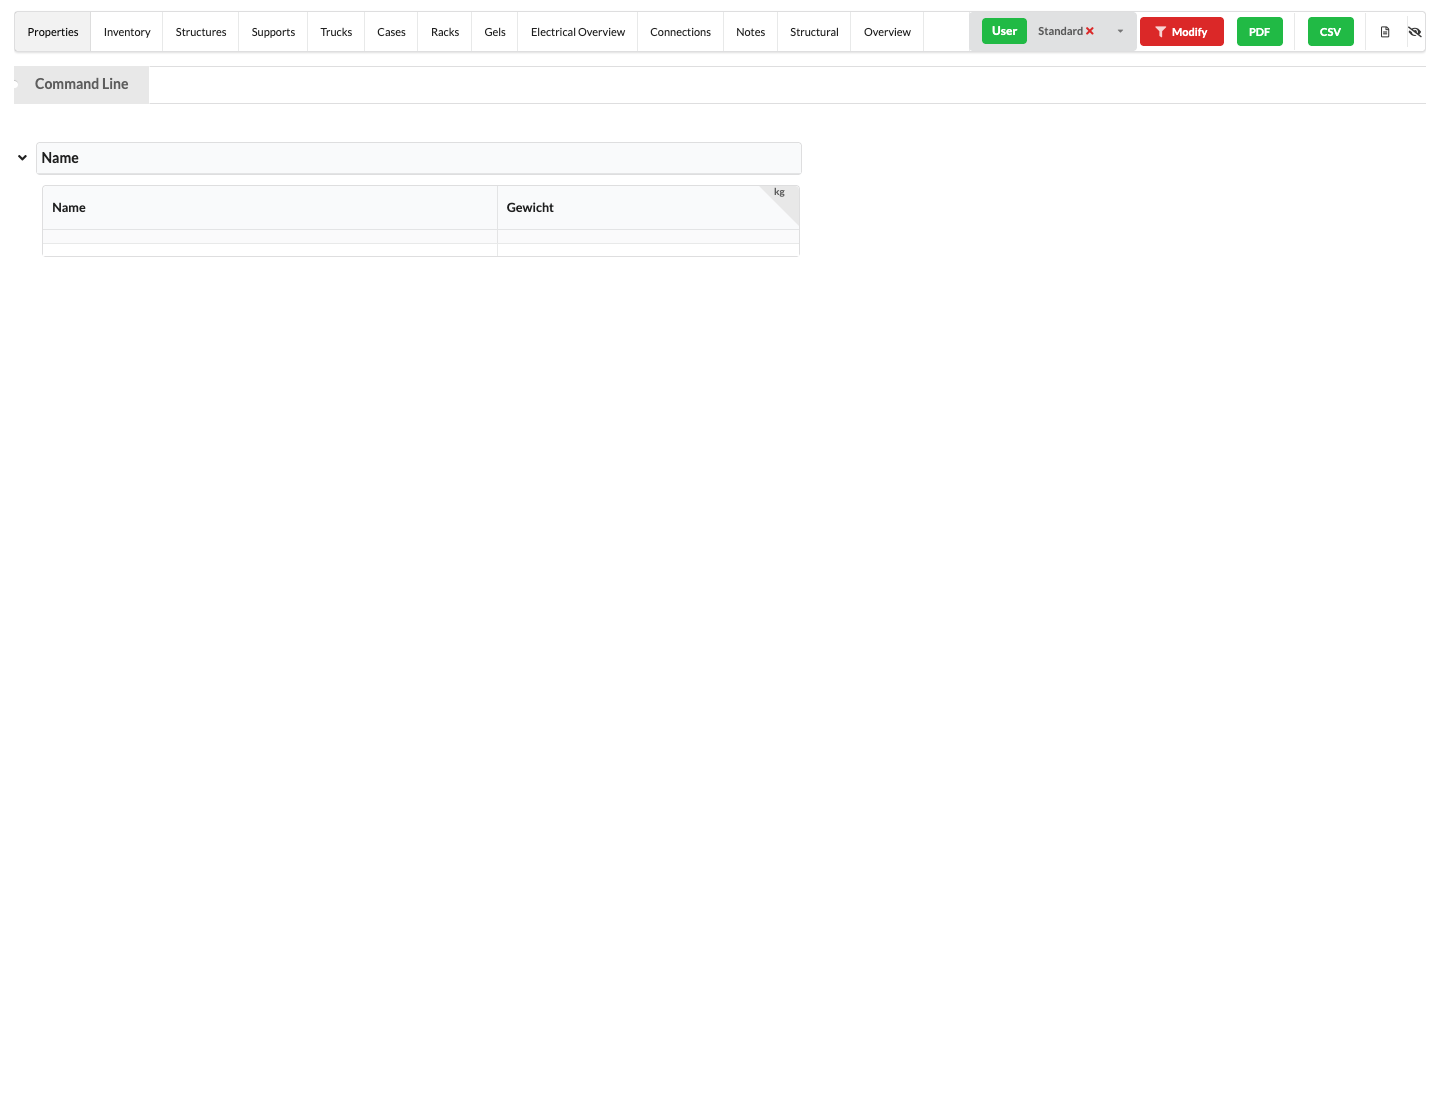
The Worksheets window contains the following areas and controls:
Select a view tab to switch to the corresponding list. The tabs shown depend on the active workspace. Each view has its own columns, filters, and editing options.
Click Filter to the right of the view tabs to show or hide the filter area. Available filters vary by list. Check the filters if expected objects are missing.
Click the sheet icon to the right of the tabs to show the Assembly Sheets list. On a mobile device, the icon opens and closes the list instead of the table. Assembly sheets group defined assemblies or parts of your drawing. You can create them through Navigation, the Menu Bar, or the Context Menu in the Scene Tree. In the creation dialog, you can choose a template and an existing timeline step. The User selection list is not currently populated reliably. Create the assembly sheet, then assign drawing users through the User column. In a linked online project, each assembly sheet also appears as a task; the task overview shows its status.
Select Scene for the entire drawing or an assembly sheet for its associated objects. In the sidebar, you can filter assembly sheets by name or timeline step, rename one by double-clicking it, and reorder them by dragging. The red delete icon removes the corresponding assembly sheet immediately, so check the sheet name before clicking it. Properties... and Duplicate apply to the selected sheet.
When you select an assembly sheet, a QR code for its online view is also displayed. The link works only for an online project. Recipients need project access unless you use a public sharing link; see Share a project link and QR code for details.
The QR code workflow explains how to create assembly sheets and open their QR codes with the QR code scanner.
The Create Assembly Sheet dialog opens from the commands mentioned above when you have selected objects or assemblies, or from the sheet icon on a layer or class. Under Linked Preset, select the template for the sheet view; Default is selected initially. Under Linked State, assign a timeline step to the sheet. Name adds the name of each selected object or area. When several objects or assemblies are selected, OK creates a separate assembly sheet for each one with this suffix. A sheet is also created for a selected layer or class. Cancel closes the dialog without creating a sheet. The User selection list is intended for a default assignment, but is not currently populated reliably. After creating the sheet, assign drawing users through the User column; an assignment made there is applied immediately. Other ways to create sheets, including commands for all existing assemblies, are described under Create assembly sheets.
The Total Time in the Navigation list is the Required Time saved in the assembly sheet. You can enter it for work planning or derive it from the time values of the included objects.
Do Not Overwrite Time is enabled by default. In the current version, however, it does not reliably protect the calculated time from recalculation. Check the displayed value after changing the included objects. A value of zero is currently not transferred as a change when you confirm with OK; resetting the value to zero requires a correction.
The table shows data for the selected view and scope. Some fields are editable, while others display calculated or summarized values. The section for each list explains which entries you can make.
Click a column heading to sort the contents by that column. Hold Shift while clicking to sort by multiple columns. Click and drag the dividers between columns to adjust their widths. Drag and drop columns to change their order.
In many tables, column headings also show the relevant unit when a field uses a length, weight, area, or another measurement. Sorted columns also display a small sort-order number so you can identify the active sort order.
The right side of the window displays the rendered objects in your workspace. To save space, show or hide the entire area with the eye icon to the right of the view tabs. Use Saved View to open a view previously created in Navigation. In the worksheet settings, you can also set Linked Saved View to specify which view is saved with the worksheet and restored when it is opened.
Under Window → Worksheets, select the Properties view to review and change object values in Scene or in the selected assembly sheet. You choose which properties appear as columns and which objects are included in the table. For example, you can compare patch or position values for several devices.
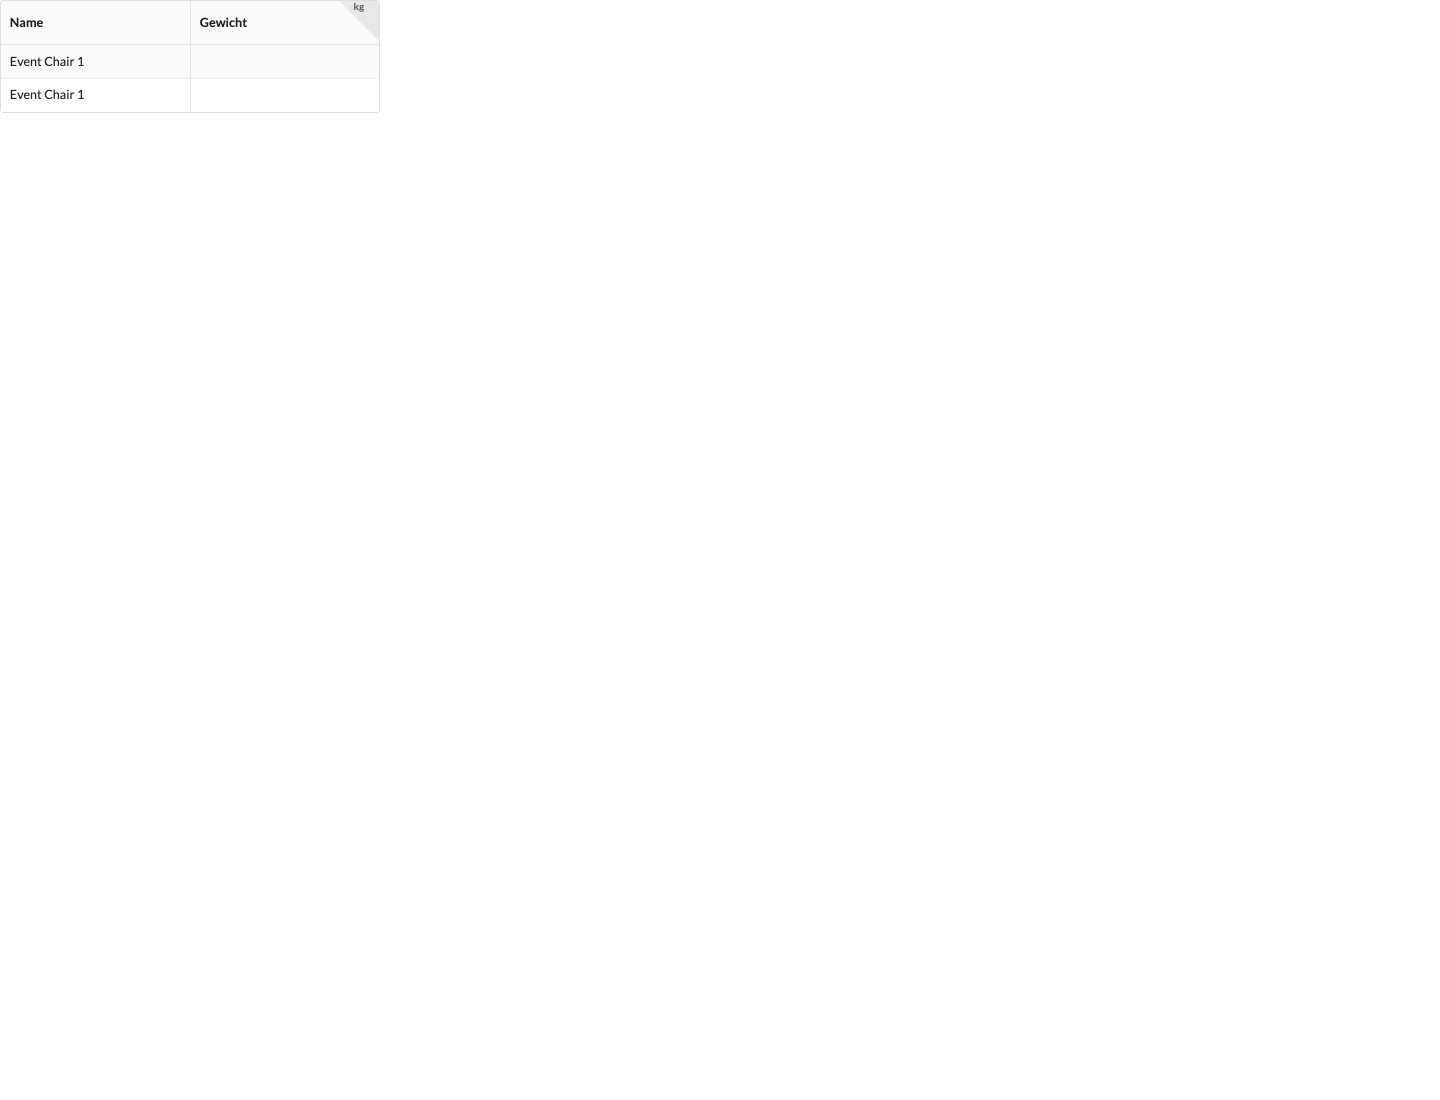
The table shows two objects named Event Chair 1 and the Name and Weight columns. Clicking a cell selects its object; column headings sort the table.
Templates save columns, groupings, and filters for this table view and its PDF export. Set up the view and select Create to save it under a name. To edit it, select an editable template, adjust the view, and click Update. Update is disabled for an unchanged or read-only template. Table templates differ from object presets in Navigation.
Under Properties, choose the table columns. Expand a property group if needed and enable the fields you want. Use Search... to find a property by name. If no column is selected, the table offers Add Default Name Column....
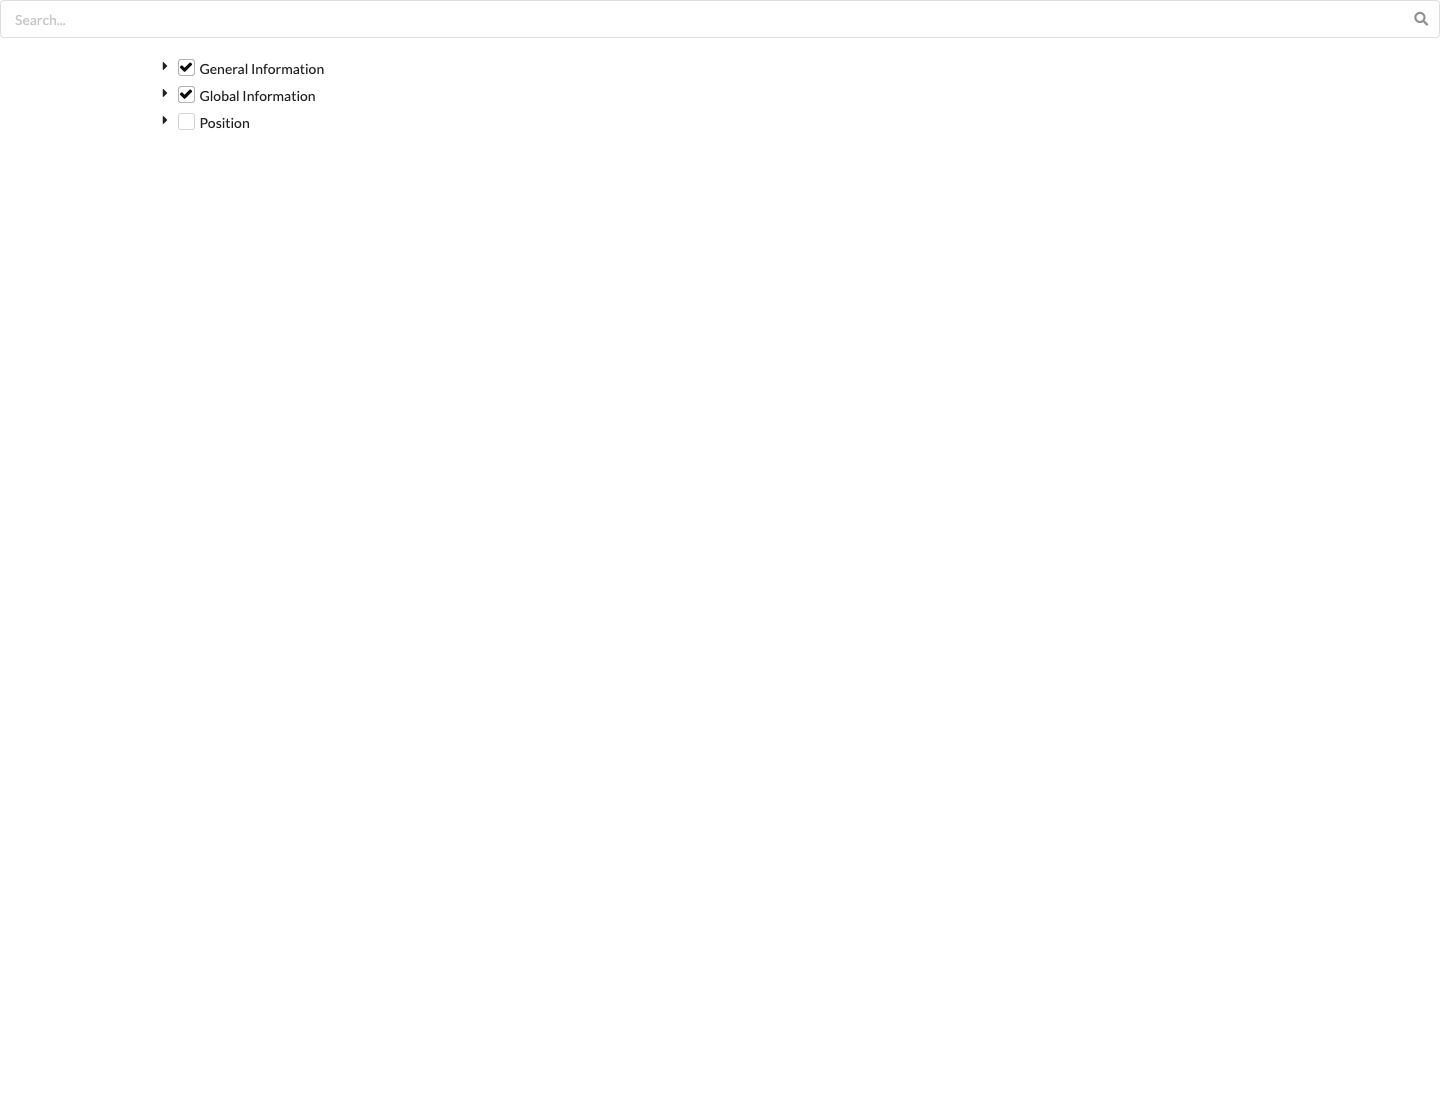
The search field narrows the displayed properties by name. Click the arrow to the left of a group to expand or collapse its fields; use the checkboxes to select individual properties as table columns. A check mark identifies a column that is already enabled. The magnifying glass does not trigger a separate action; it marks the search field.
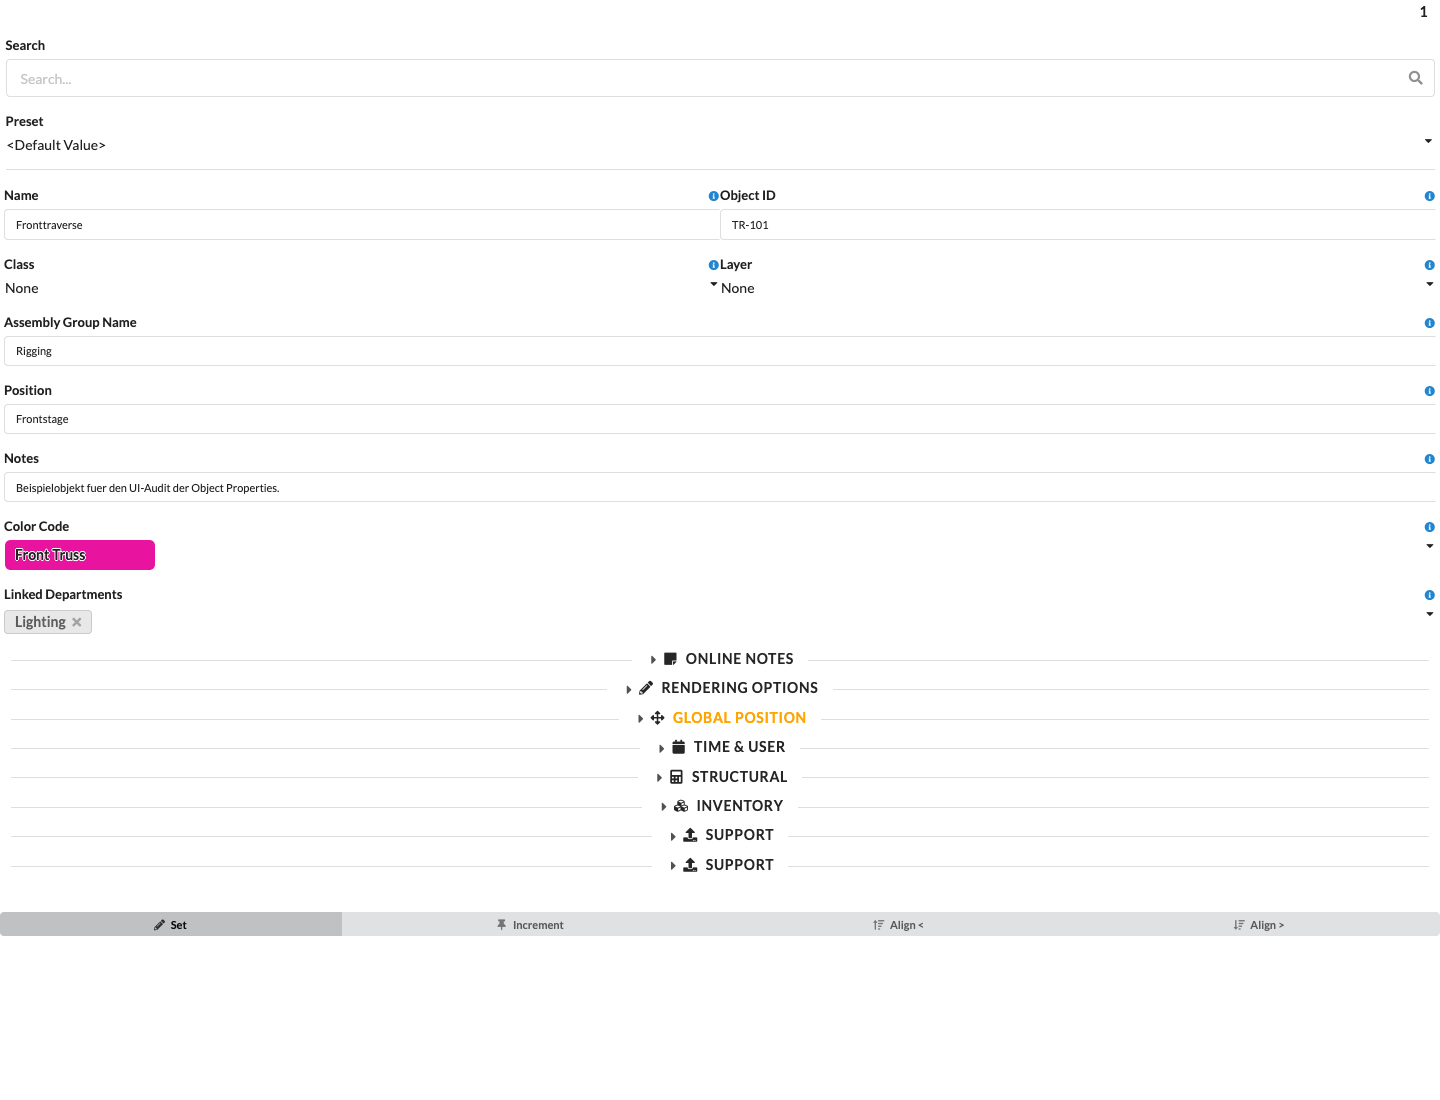
This capture shows the properties of a single object. Search filters the displayed properties; Preset selects a saved object setting. Fields such as Name, Object ID, Class, Layer, Assembly Group Name, Position, Notes, Color Code, and Department display or edit the corresponding object values. The blue information icons open details about the associated properties. The arrows next to Annotations, Display Options, Global Position, Time & User, Static Values, and Inventory expand or collapse those groups. Under Insert Offset, Enable Auto Insert Spacing toggles automatic spacing control; the plus and minus buttons beside the X, Y, and Z values increase or decrease the corresponding offset. The values in the image are examples.
To change a property's label in the table and printout, right-click its column heading and select Rename Property. This is the current label in the context menu. The Rename Property in Printout dialog shows the existing property name as a field label; enter the new name below it. OK applies it to the active drawing and updates the view. Cancel, the red close icon, or Escape closes the dialog without changes. The input field is initially empty, and the dialog does not reject an empty entry. Enter a label before selecting OK. The alternate label renames neither the property itself nor the object.
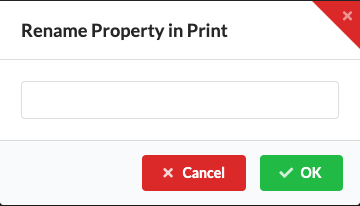
The column-heading context menu also contains Reset Property Names and Remove Column. These actions do not change the label in the dialog.
Under Group By, objects with the same property values are combined into groups. Multiple groupings create nested groups. Add Indent indents nested groups in the view; Show Summary adds a summary of the selected numeric fields. These controls do not change object values.
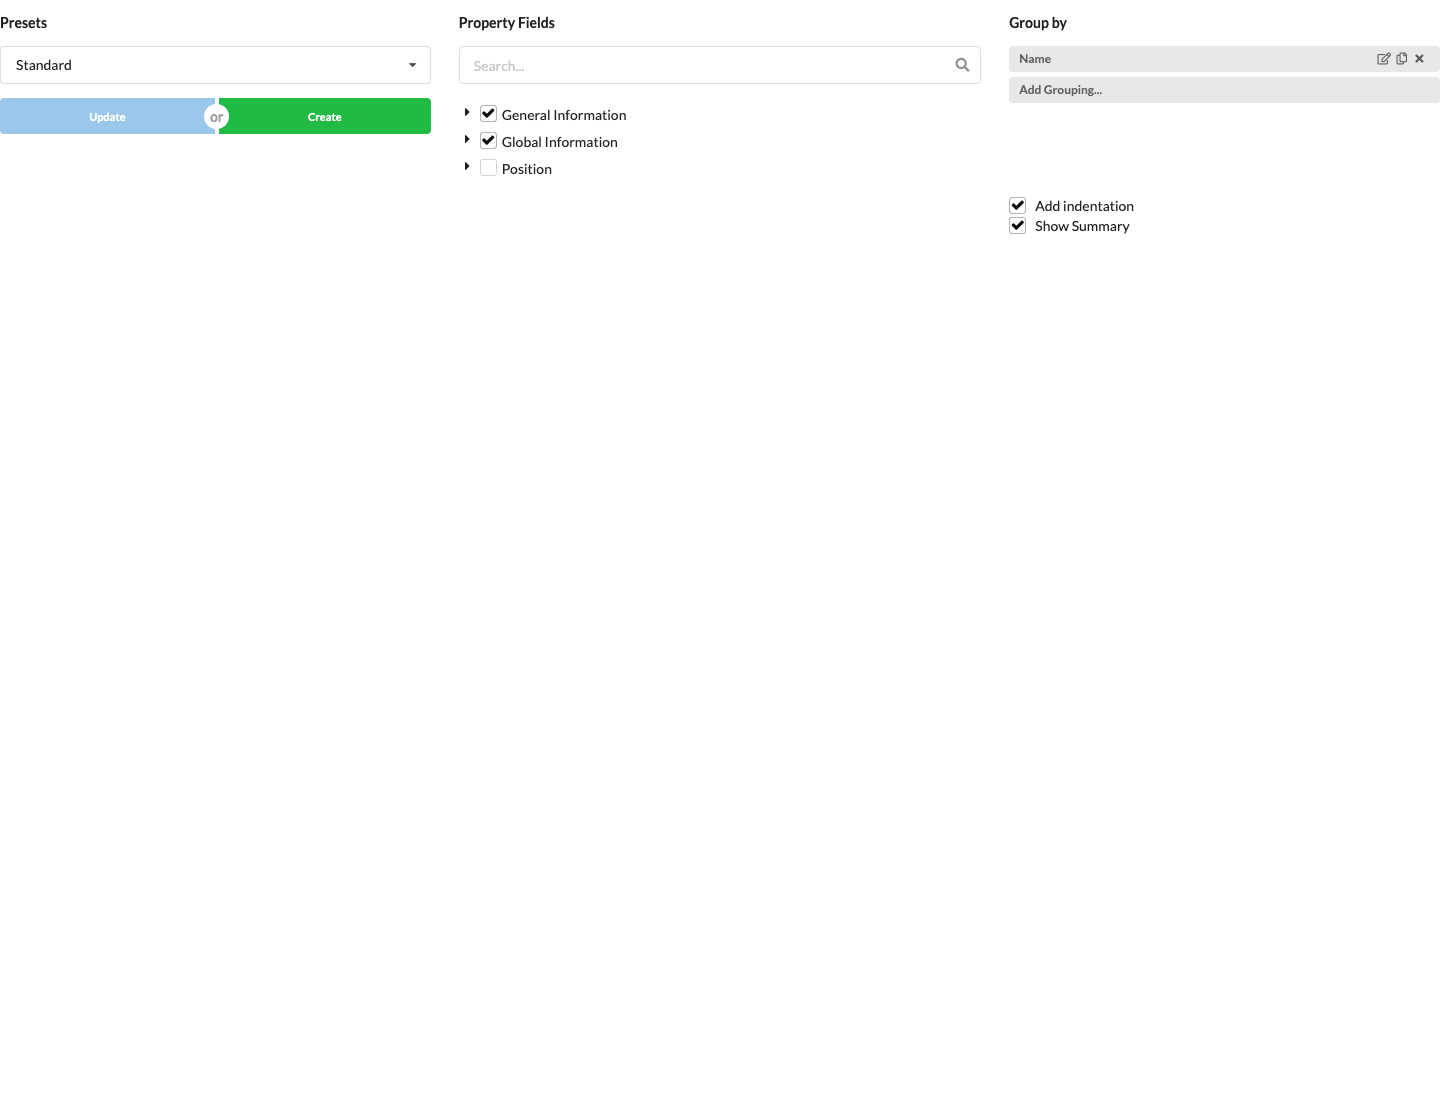
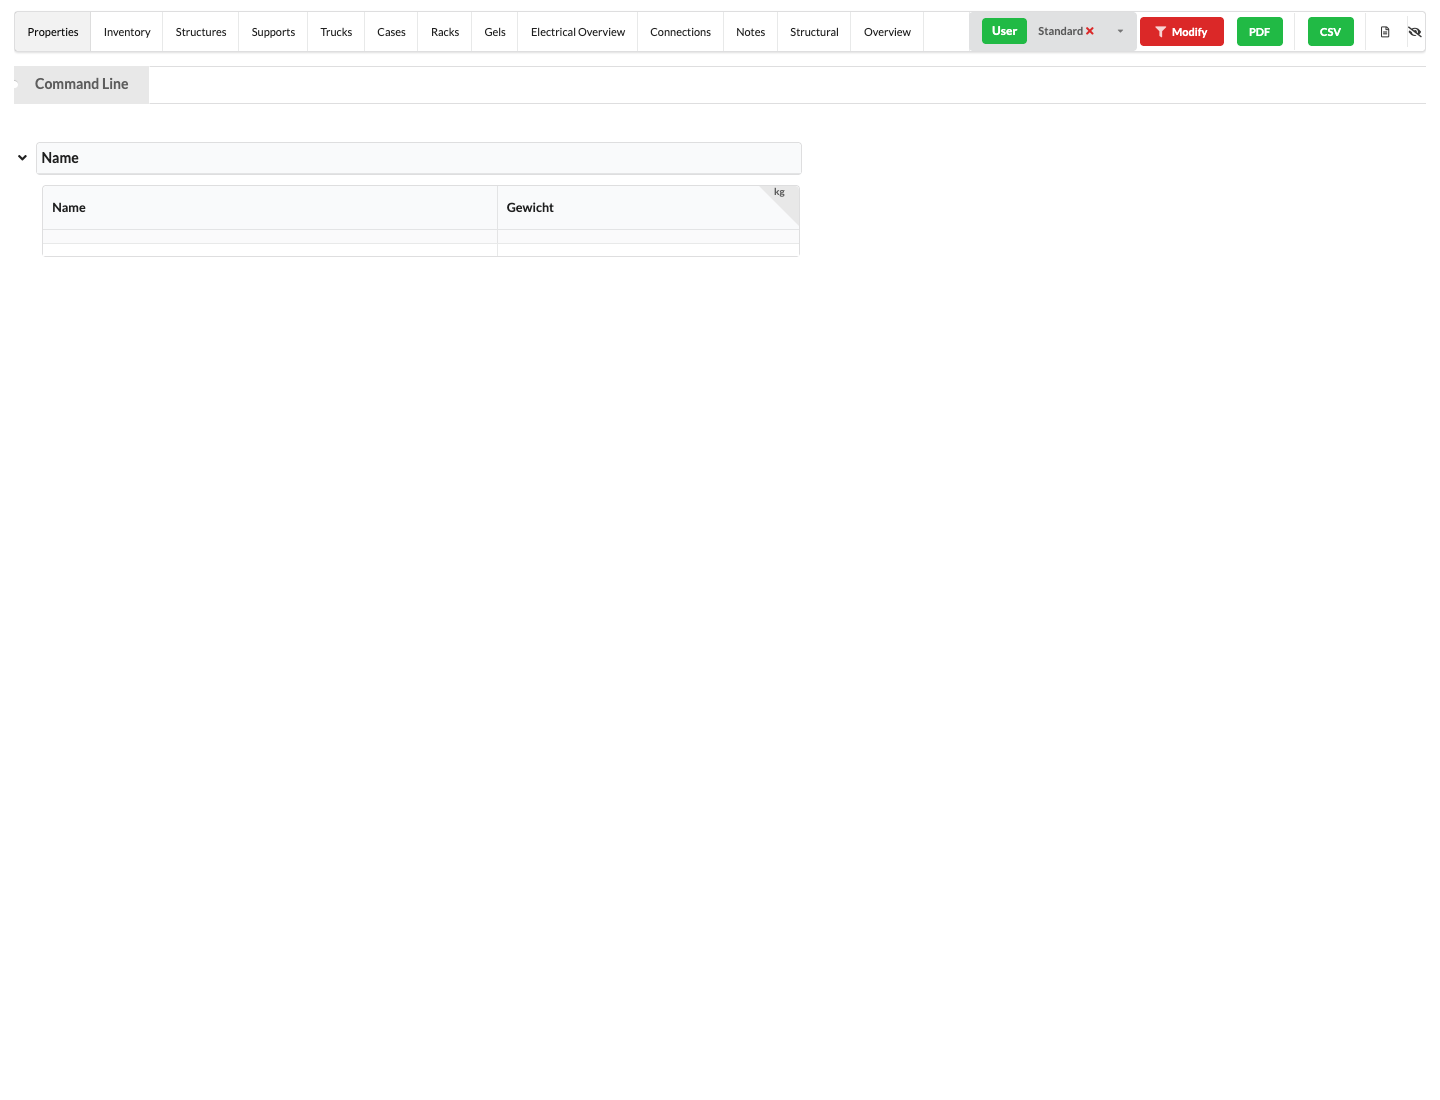
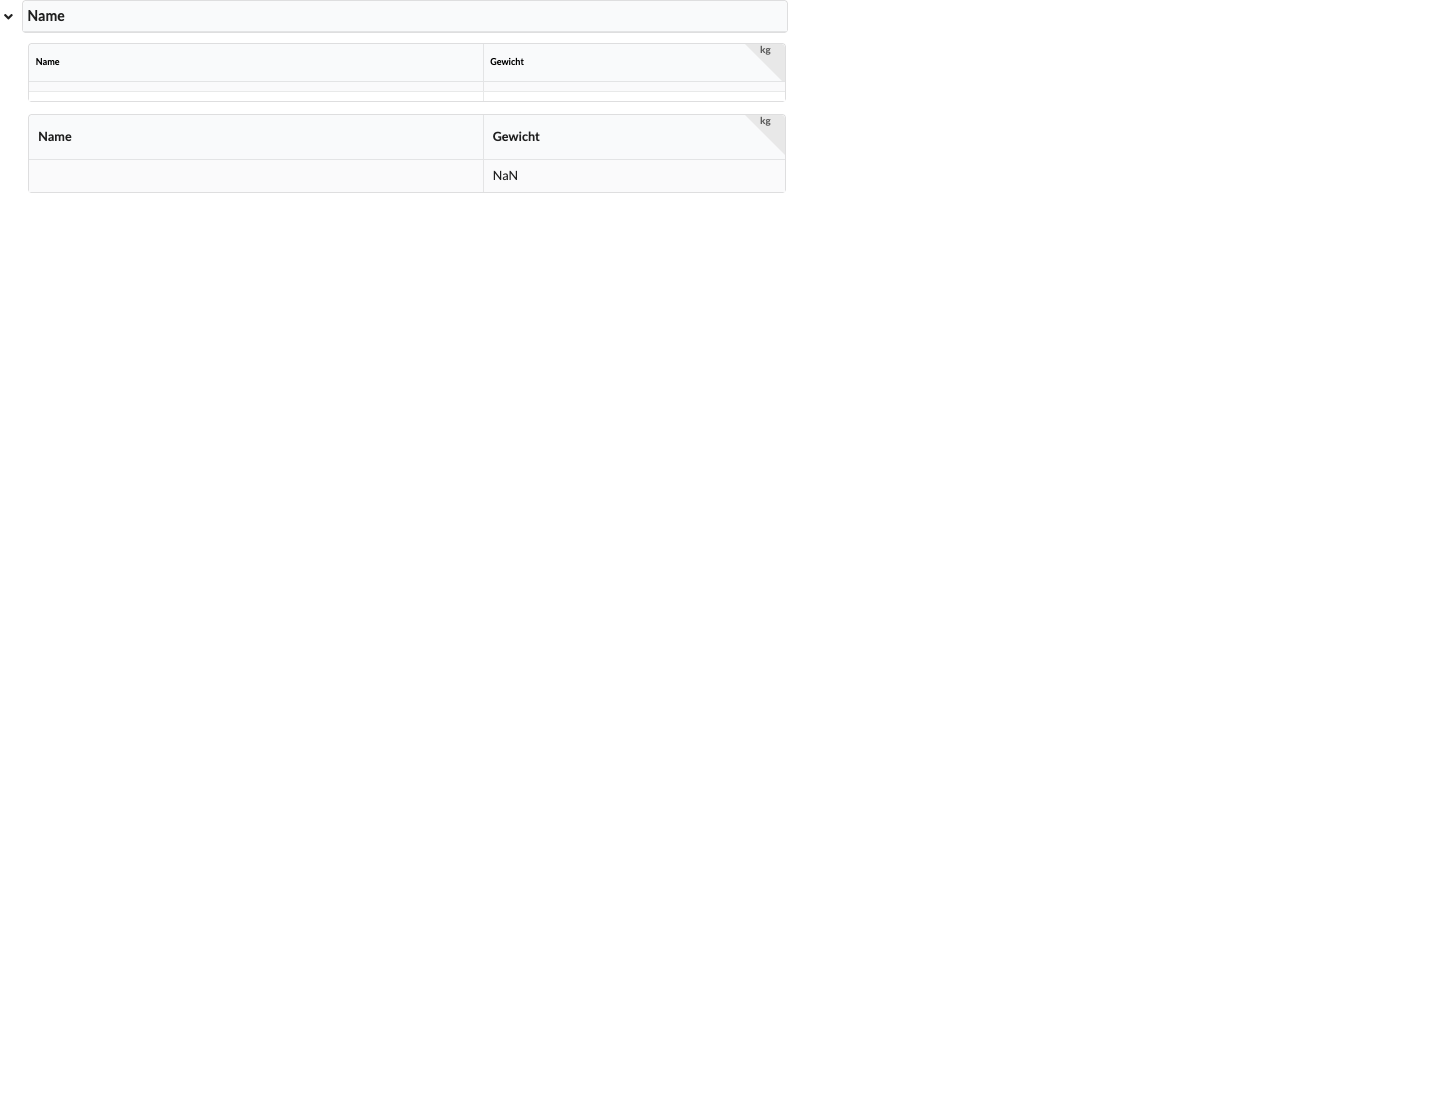
The narrow capture shows a grouping by Name. The pencil icon opens the grouping for editing, the copy icon creates another grouping with the same settings, and the cross removes the grouping. The capture contains no group values or table rows; it shows only the control row.
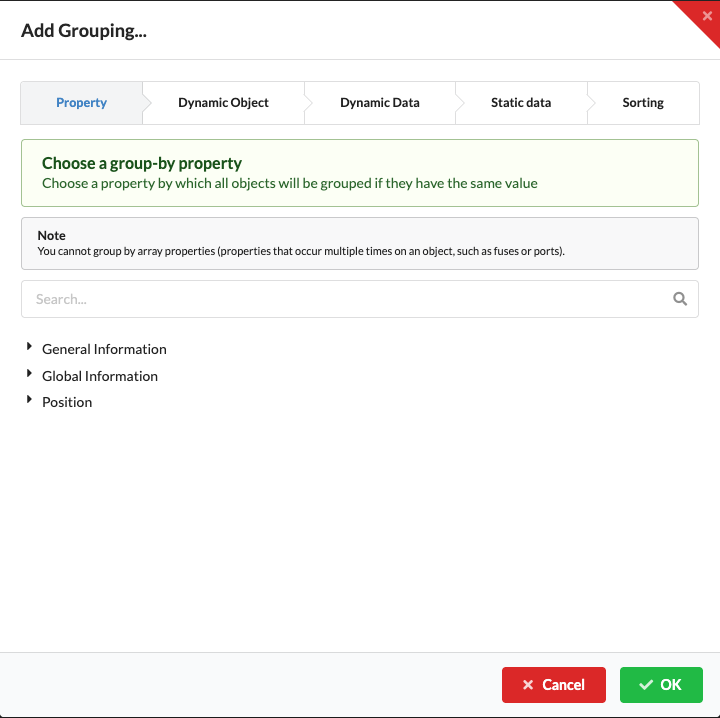
In Window → Worksheets, open the Properties view and select Add Grouping... under Group By. The dialog offers the steps Property, Dynamic Object, Dynamic Data, Static Data, and Sorting. First choose a grouping key under Property. OK remains disabled until a property is selected. Properties with multiple values per object, such as Fuses or Ports, cannot be selected as grouping keys.
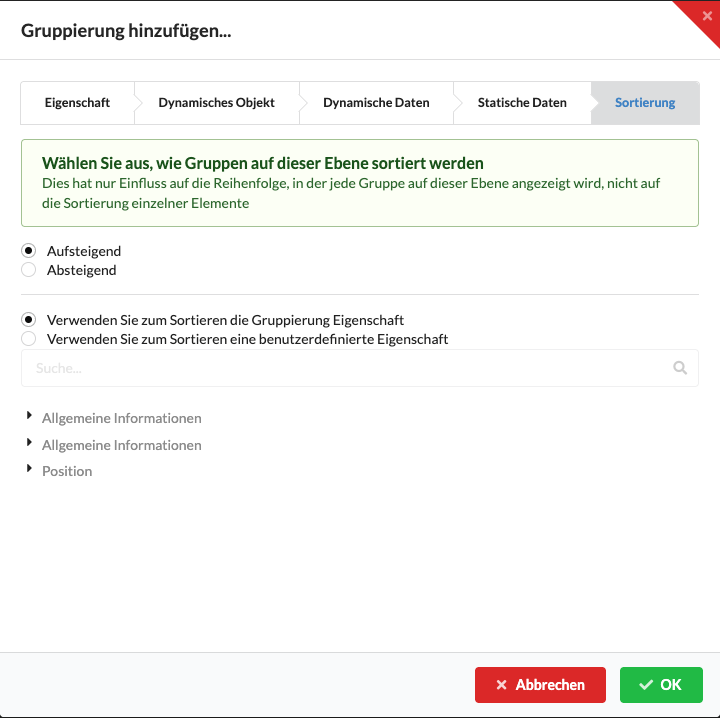
On the Dynamic Object tab of the grouping dialog, choose the source of additional information in the group heading. There are four options:
5 × 125 m, 10 × 200 m, 20 × 500 m).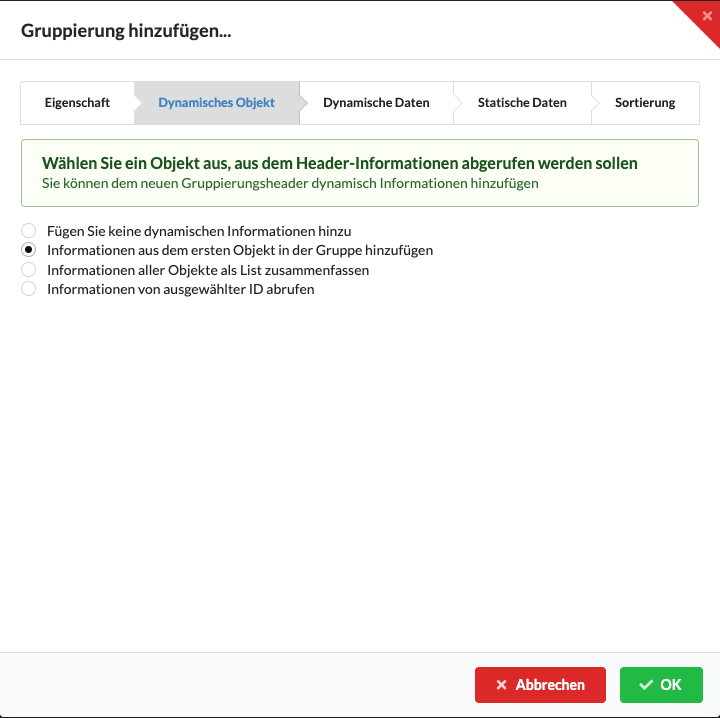
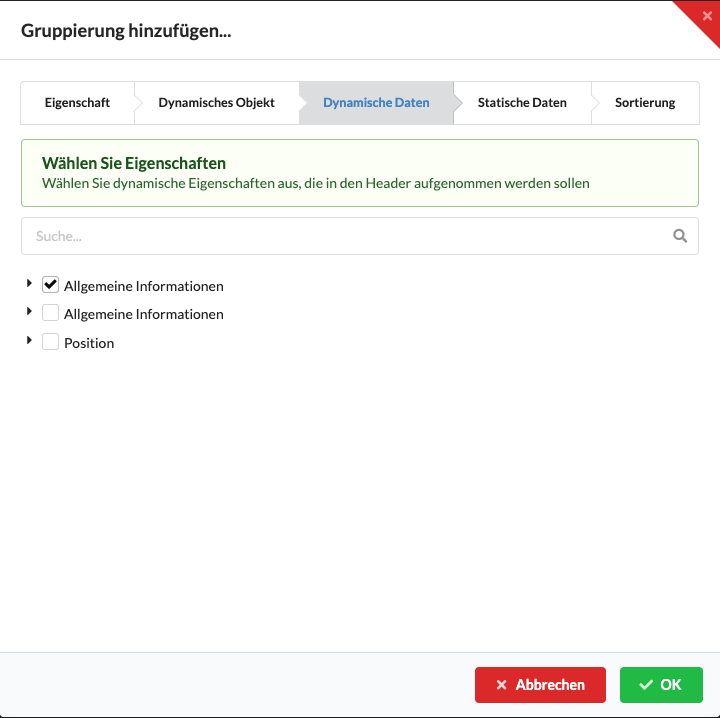
Under Dynamic Data, select one or more properties for the group heading. This tab is available when a data source has been selected under Dynamic Object.
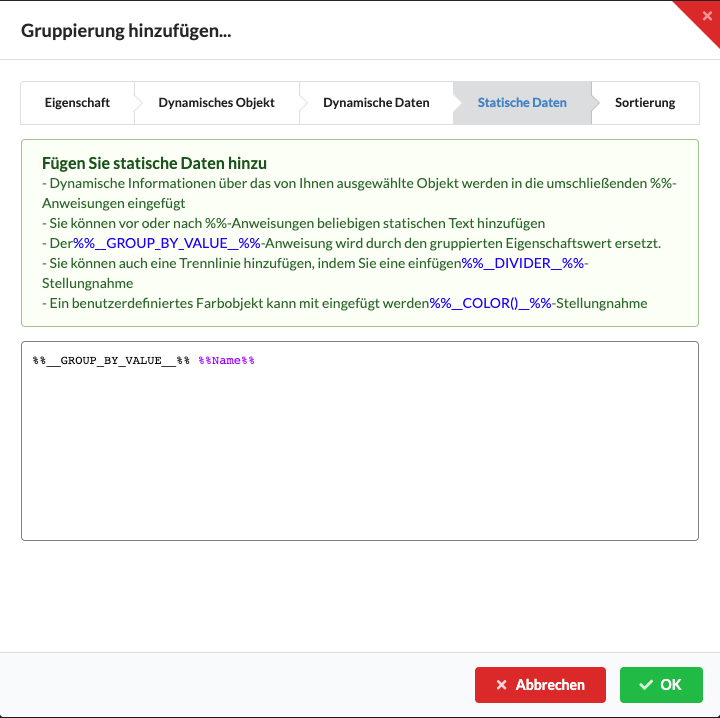
Under Static Data, you can combine text and placeholders for the group heading:
%%__GROUP_BY_VALUE__%% is replaced with the value of the selected grouping property.%%__DIVIDER__%% starts another cell in the group heading.%%__COLOR(black;red;gold)__%% adds a color field with several colors; separate color names with semicolons. Multiple colors appear as adjacent stripes.%%Name%% is an example of the value of a selected property. Use the same format with the property name for other properties.If you select properties under Dynamic Data, the dialog inserts the corresponding placeholders here. Check the group heading in the table afterward; object values are not inserted when Do not add any dynamic information is selected.
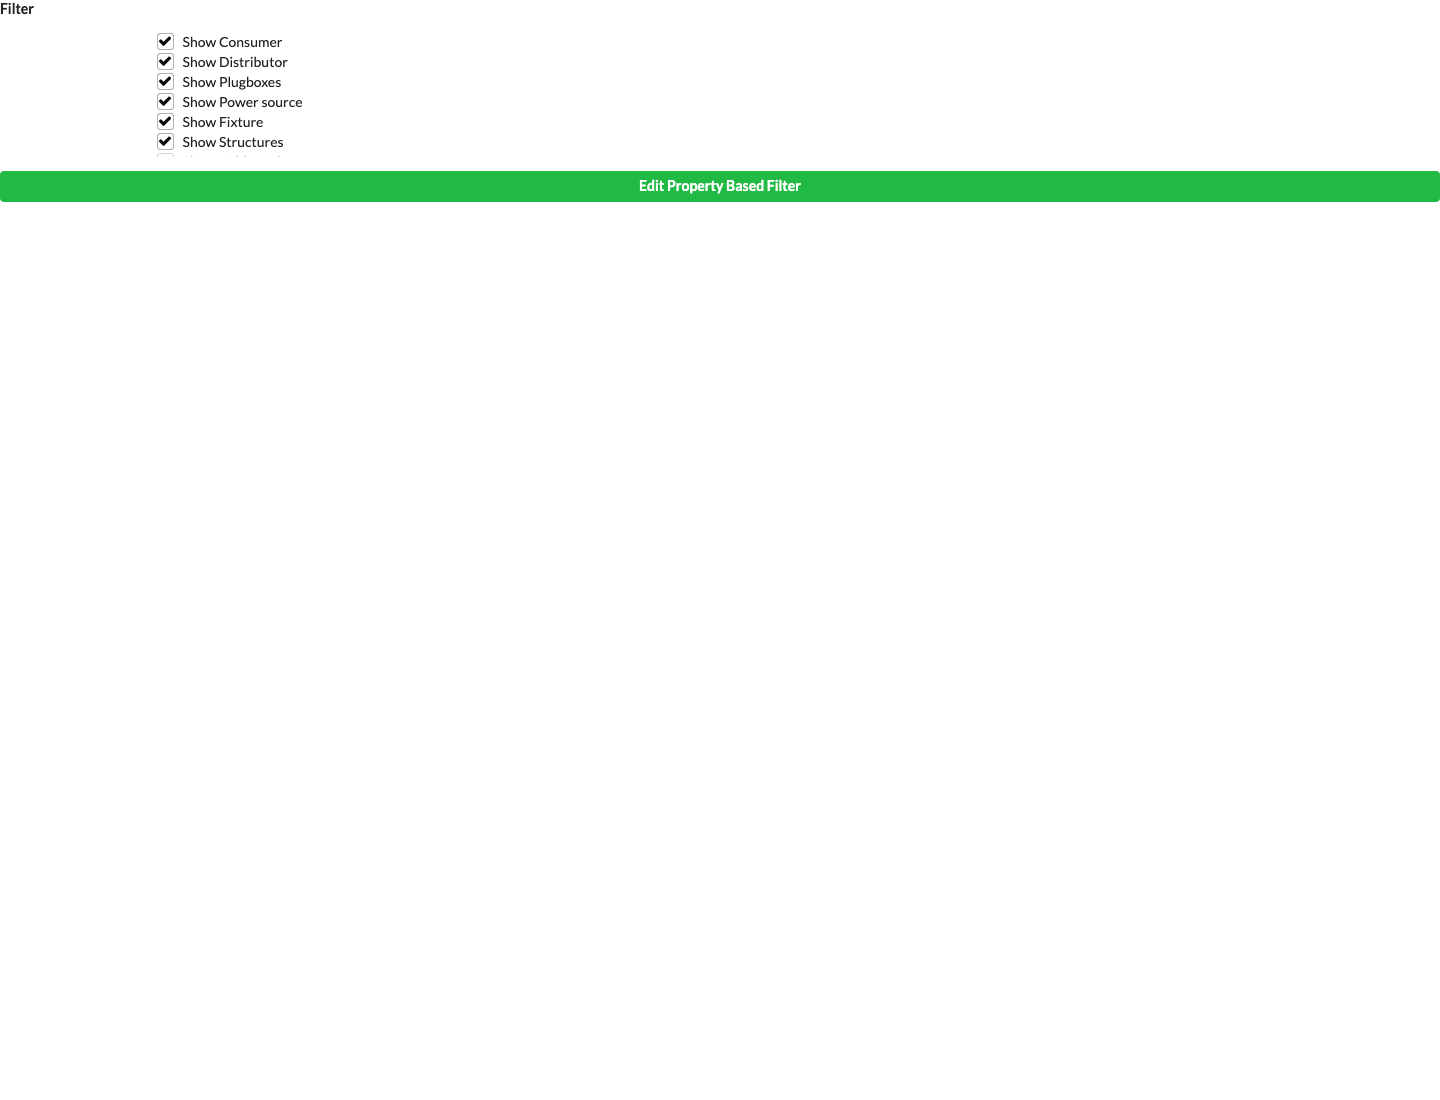
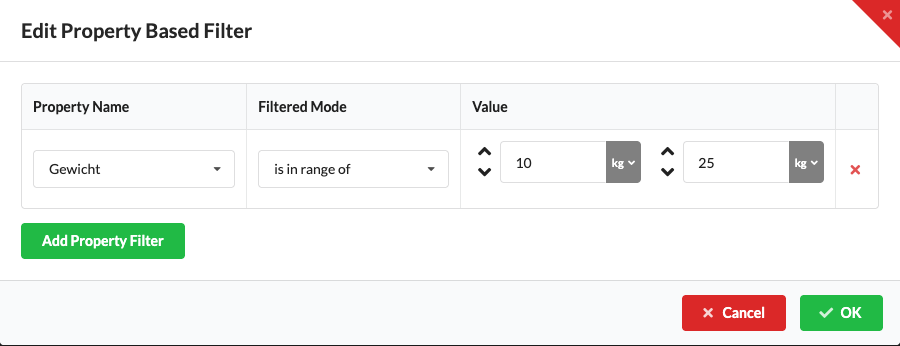
Open Filter using the funnel icon. Use the object-type switches to limit the table, for example, to fixtures, consumers, or structures. Select Edit Property Filters to set additional conditions: choose Property Name, Filter Mode, and Value. Numeric values support comparisons and ranges with units; text options include contains text and starts with text. Add rows as needed with Add Property Filter and confirm with OK. If entries are missing, remove individual conditions with the red cross or check the object-type switches.
The object-type switches include power consumers and distributors, plug boxes, house connections, fixtures, structures, cable paths, supports, Ground Supports, rigging points, audio, meshes, dock points, and assemblies. You can also toggle Show Invisible Objects or Hide Unselected Objects. Show Electrical Inputs and Show Electrical Outputs appear only when the current view provides connection fields. These filters are locked in edit mode.
In the Properties overview filter area, open Edit Property Filters. The dialog offers properties supported for filtering by the current view that do not contain multiple values per object. Choose Property Name, Filter Mode, and the appropriate Value. For a numeric range, enter both limits with units; use Add Property Filter to add another condition. OK applies the conditions to the table. Cancel or closing the dialog discards changes. The button is disabled during edit mode.
The table displays the selected columns for objects in the current view that meet the filters. Select a cell and change its value through the Command Line above the table. Some calculated or read-only properties cannot be changed this way; check the displayed value after entering it.
On touch devices, you can select values in a column together: press and hold a cell briefly until the selection frame appears, then drag across the desired rows. Swiping without pressing and holding first scrolls the table.
Click a column heading to sort by that column. Hold Shift to sort by multiple columns. Drag the dividers to change column widths; drag columns to change their order.
In the Properties overview, click a cell and enter the desired value in the Command Line above the table. Press Enter to apply the value to the property in that column. For numeric values, you can also enter a sequence such as 10+ or 10 ... 50. The table field builds a SET command for the selected property. See Command Line for the syntax and other desktop app commands.
Open Window → Worksheets and select Inventory to group materials from the drawing by their properties. In Scene, the list covers the drawing; a selected assembly sheet limits the objects included. The quantity fields distinguish Drawing Quantity, Reserve Quantity, Total Quantity, and Total Booked. Total Quantity is the sum of the drawing and reserve quantities. The booked quantity is a saved comparison value, not an automatically confirmed order.
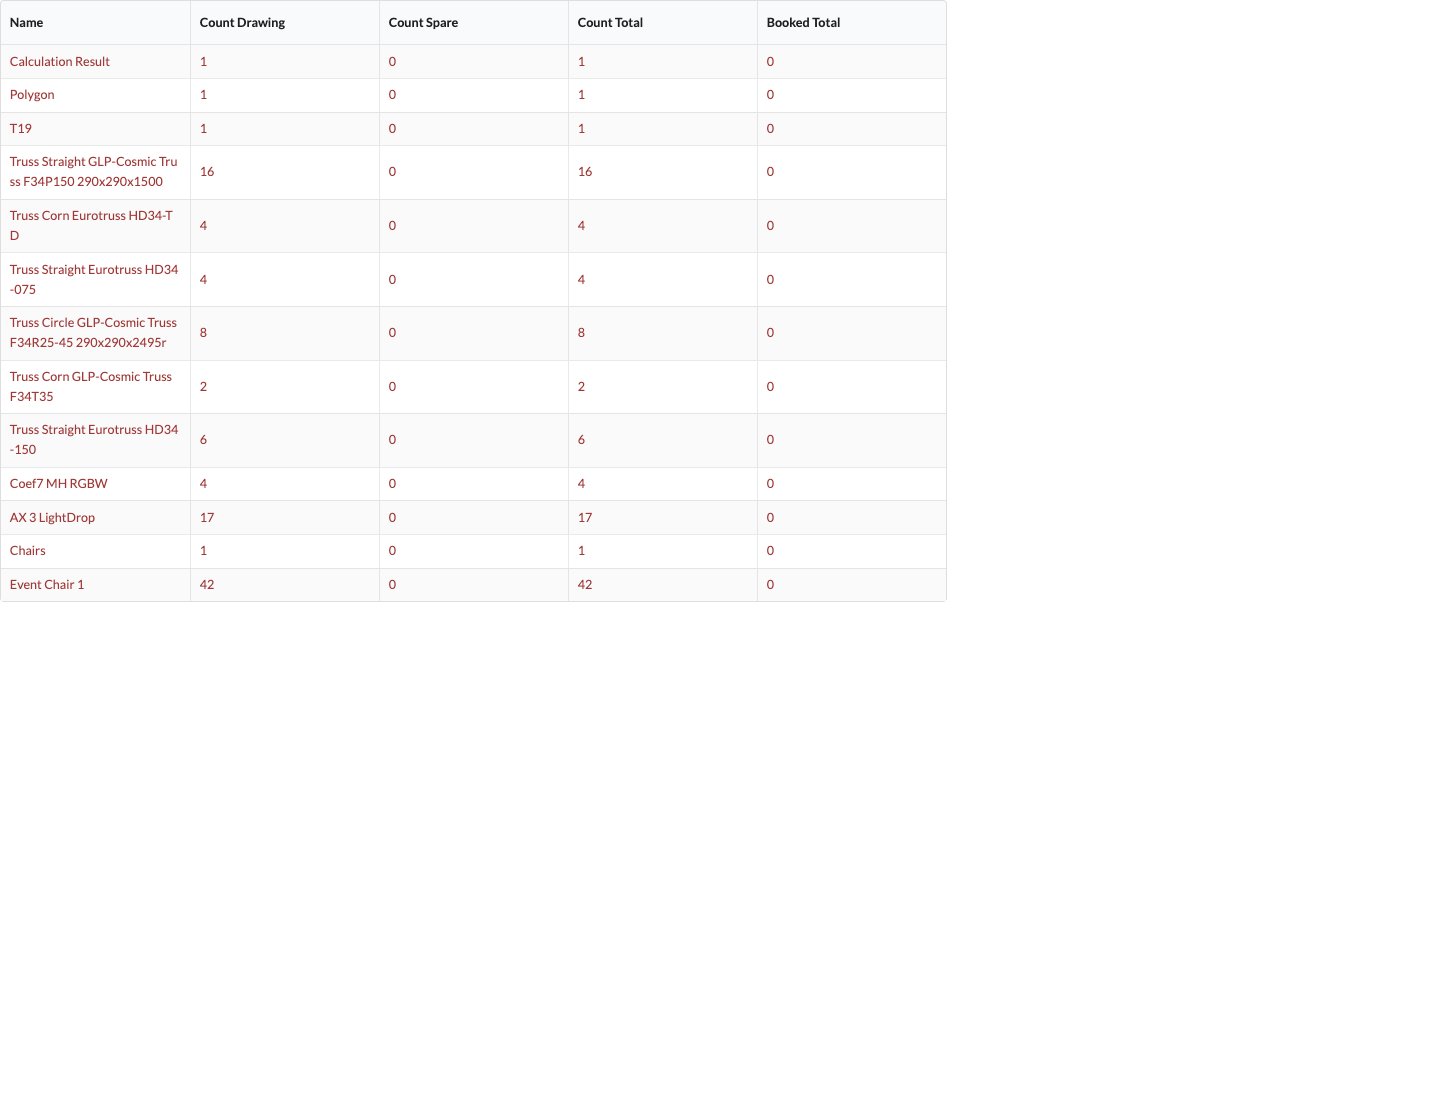
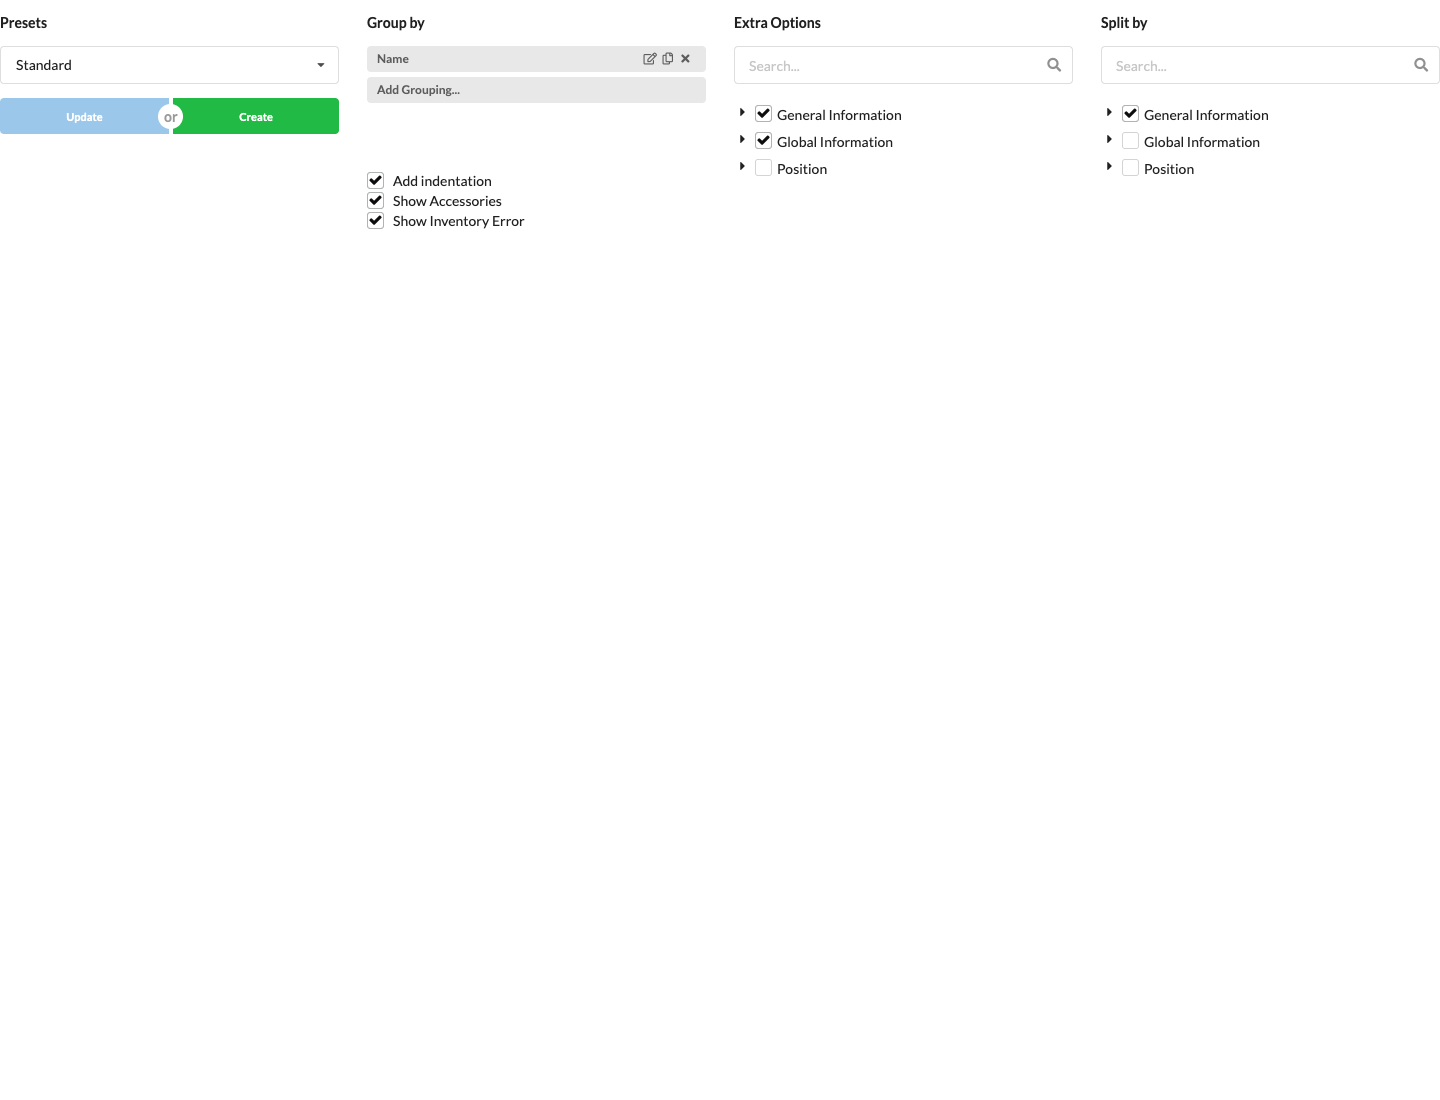
Under Templates, select a saved table configuration. Create saves the current configuration as a template; Update applies changes to an editable template. Grouping determines the row structure, Additional Options determines the displayed columns, and Split By determines the additional quantity breakdown.
Select the Reserve Quantity or Total Booked cell, enter the desired value in the table's input field, and press Enter. The table updates the value for the associated resource; Drawing Quantity is derived from the objects, and Total Quantity is calculated from it. Check the row again after entering the value. Table entry and the SET and SetInventory commands are described under Properties: Command Line and Command Line.
If a summarized row contains different suppliers or part numbers, the application warns you when you select Reserve Quantity or Total Booked. Before changing a quantity, group by Supplier and Part Number so that the value is assigned to the correct resource. The overview also lets you select objects through table cells; sorting the table does not change quantity or total columns.
Use the column headings to sort, the dividers to change column widths, and dragging to adjust the column order.
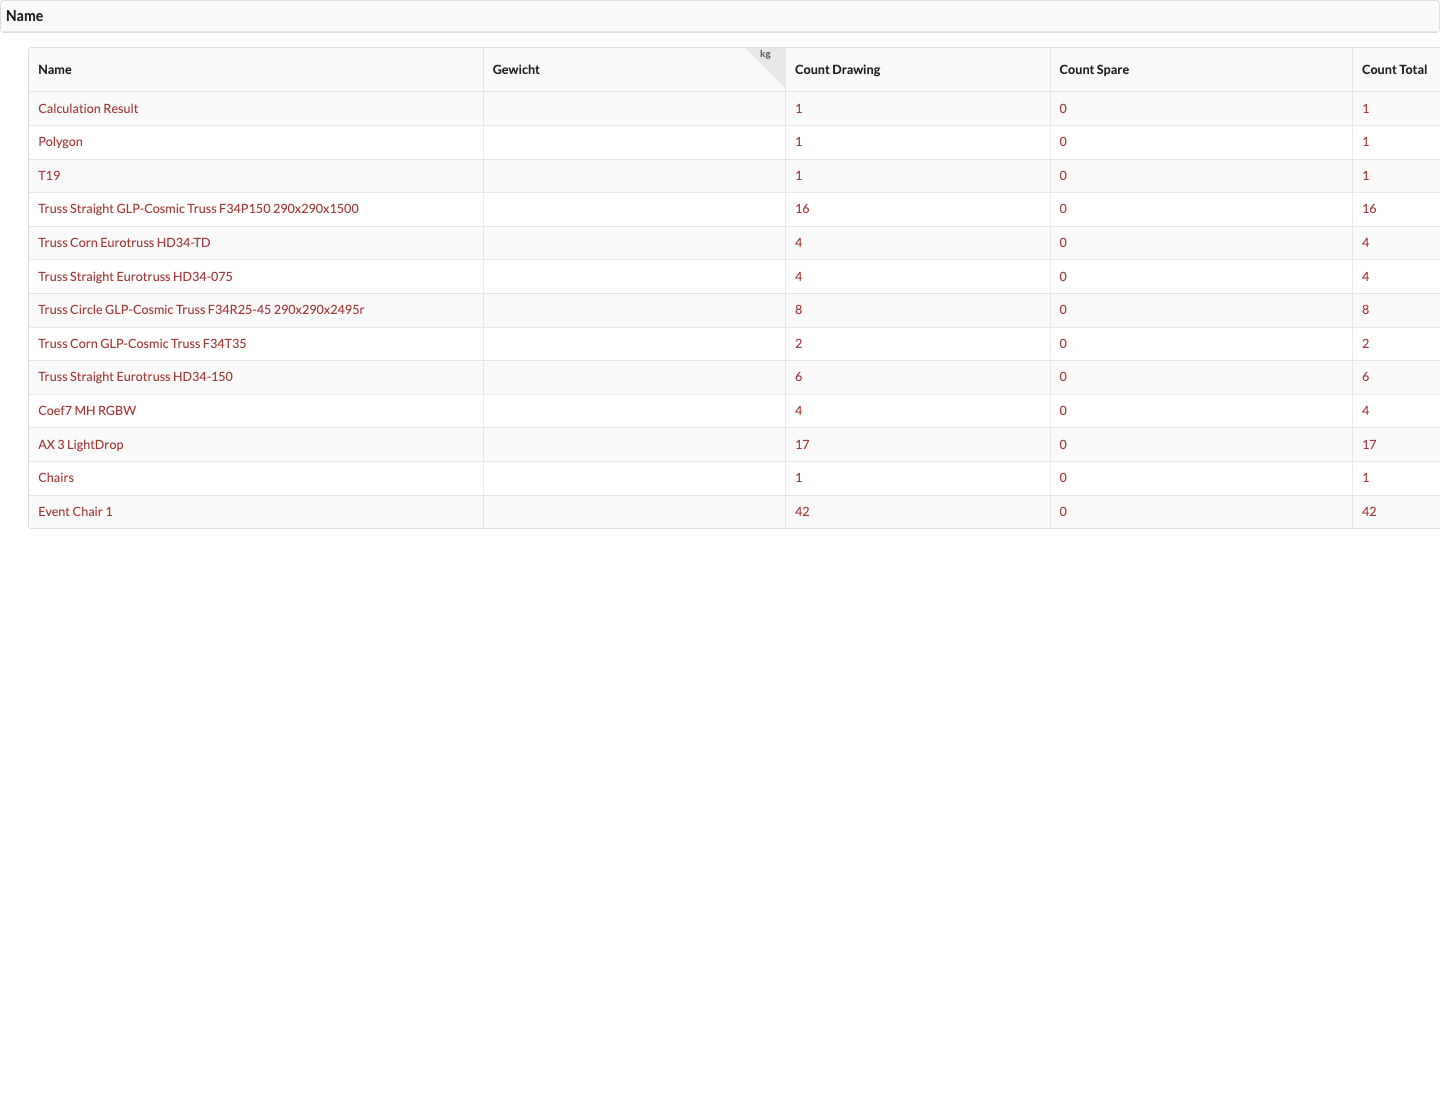
The table shows material names and drawing quantities from the replaced drawing. Red values indicate a discrepancy between the total quantity and booked quantity; check the row and selected grouping.
The capture shows the Name, Weight, Drawing Quantity, Reserve Quantity, Total Quantity, and Total Booked columns. The names and drawing quantities come from the replaced inventory drawing; reserve and booked quantities are set to zero there. No action buttons are visible; edit the corresponding table cell and press Enter to change quantities.
The Templates for the inventory list save the table configuration, including properties and filters. Select an existing template or configure the list and click Create to save it under a name. Update saves changes to the selected editable template; the button is disabled if there are no changes or if the template is read-only. Object presets in Navigation, by contrast, control object states such as position or color.
Open Window → Worksheets and select Structures to review connected structural systems. Scene displays the structures in the drawing; an assembly sheet limits the list to its area. The main rows show, among other things, Structure Name, Weight, Current Length, Load, Trim Height, Color Code, and Layer. Expand a row by clicking the arrow next to its name to view its components.
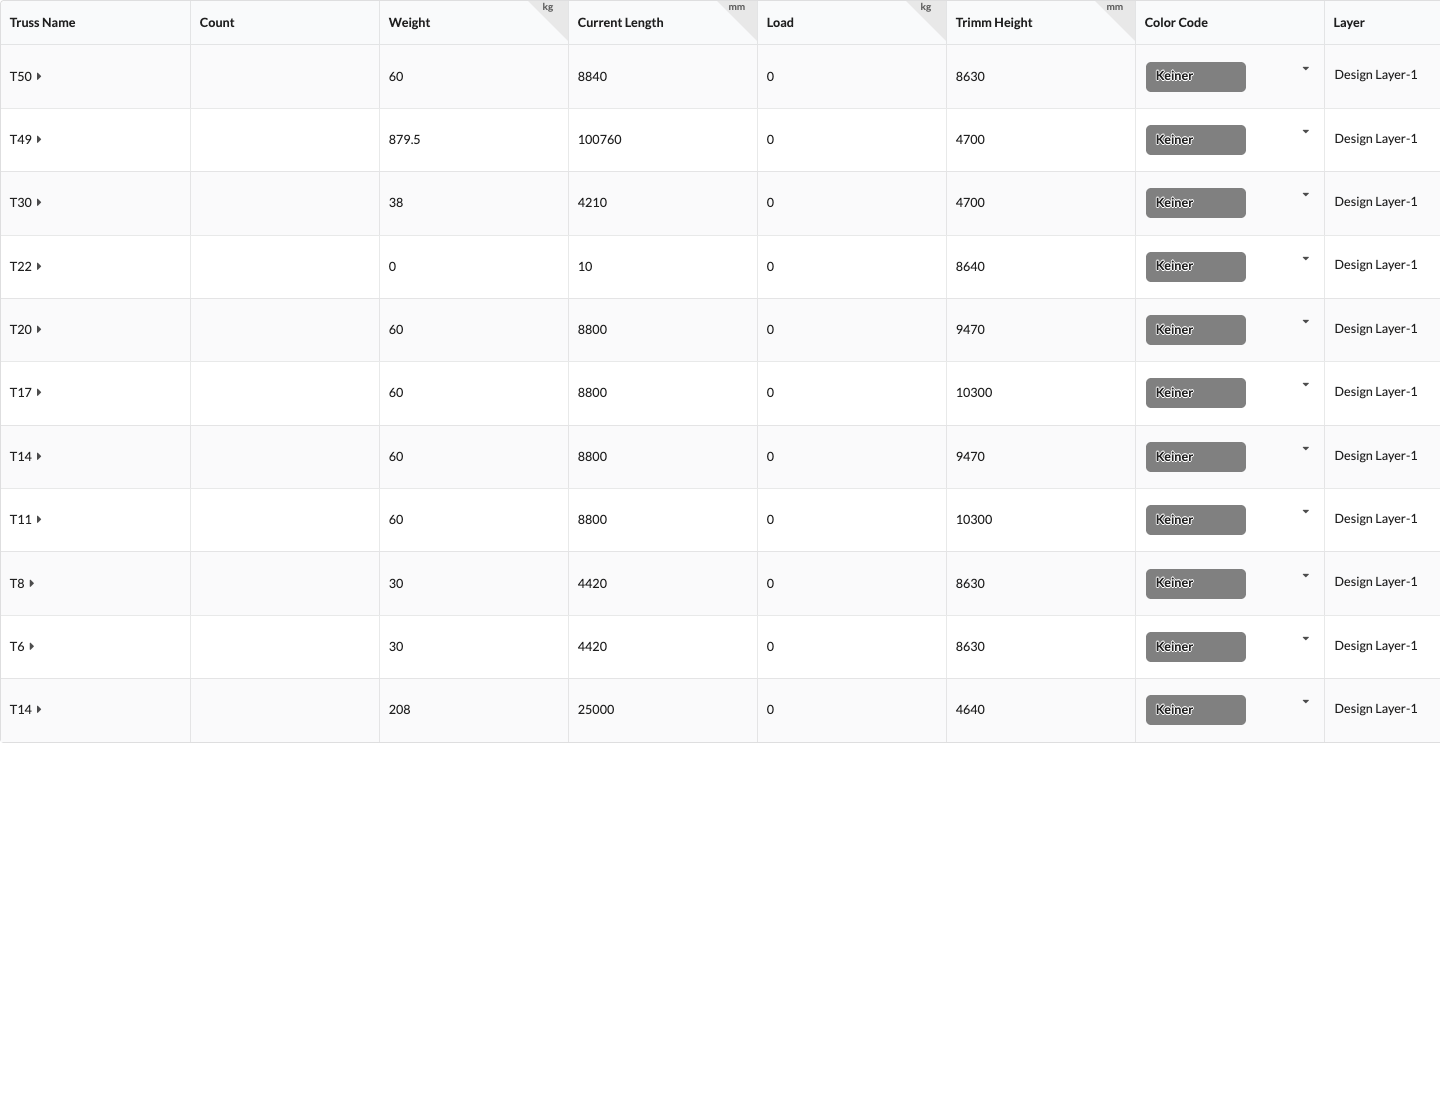
The arrow next to each truss name expands or collapses the components of the structural system. The table uses the names, weights, lengths, and trim heights from the replaced drawing; Color Code and Layer are selectable assignments, while the other values are display-only.

The two radio buttons select how the subrows are displayed: Group by Objects groups components by object; Group by Span shows straight sections with their trim height. Only one option can be active at a time. The image does not show any other switches.
You can also change Color Code and Layer in expanded object groups. With Group by Span, the subrows are display-only values. Sort the overview using the column headings; adjust column widths at the dividers.
Open Window → Worksheets and select Rigging Equipment for a list of supports with rope geometry, such as chain hoists and ropes. The view also serves as a markout list: it shows Object ID, Name, Own Weight, forces, X/Y position, and the distance to the previous point. Mounting Type distinguishes Roof Connection and Drop. The list is generated when a calculation is active; if it is empty or out of date, check the calculation in the Information Line and the objects' support geometry. When there is only one matching support, both route lists are currently empty; select Y-Sorted List to review a single point as well. The currently selected assembly-sheet view does not limit this list to its objects.
The search field filters the numbered list; it is currently not applied to the Y-Sorted List. The values here are read-only. In the numbered list, you can sort the columns and adjust their widths. The Force at Motor and Force in Roof columns currently show the same calculated reaction-force value; do not treat them as two independently calculated forces.
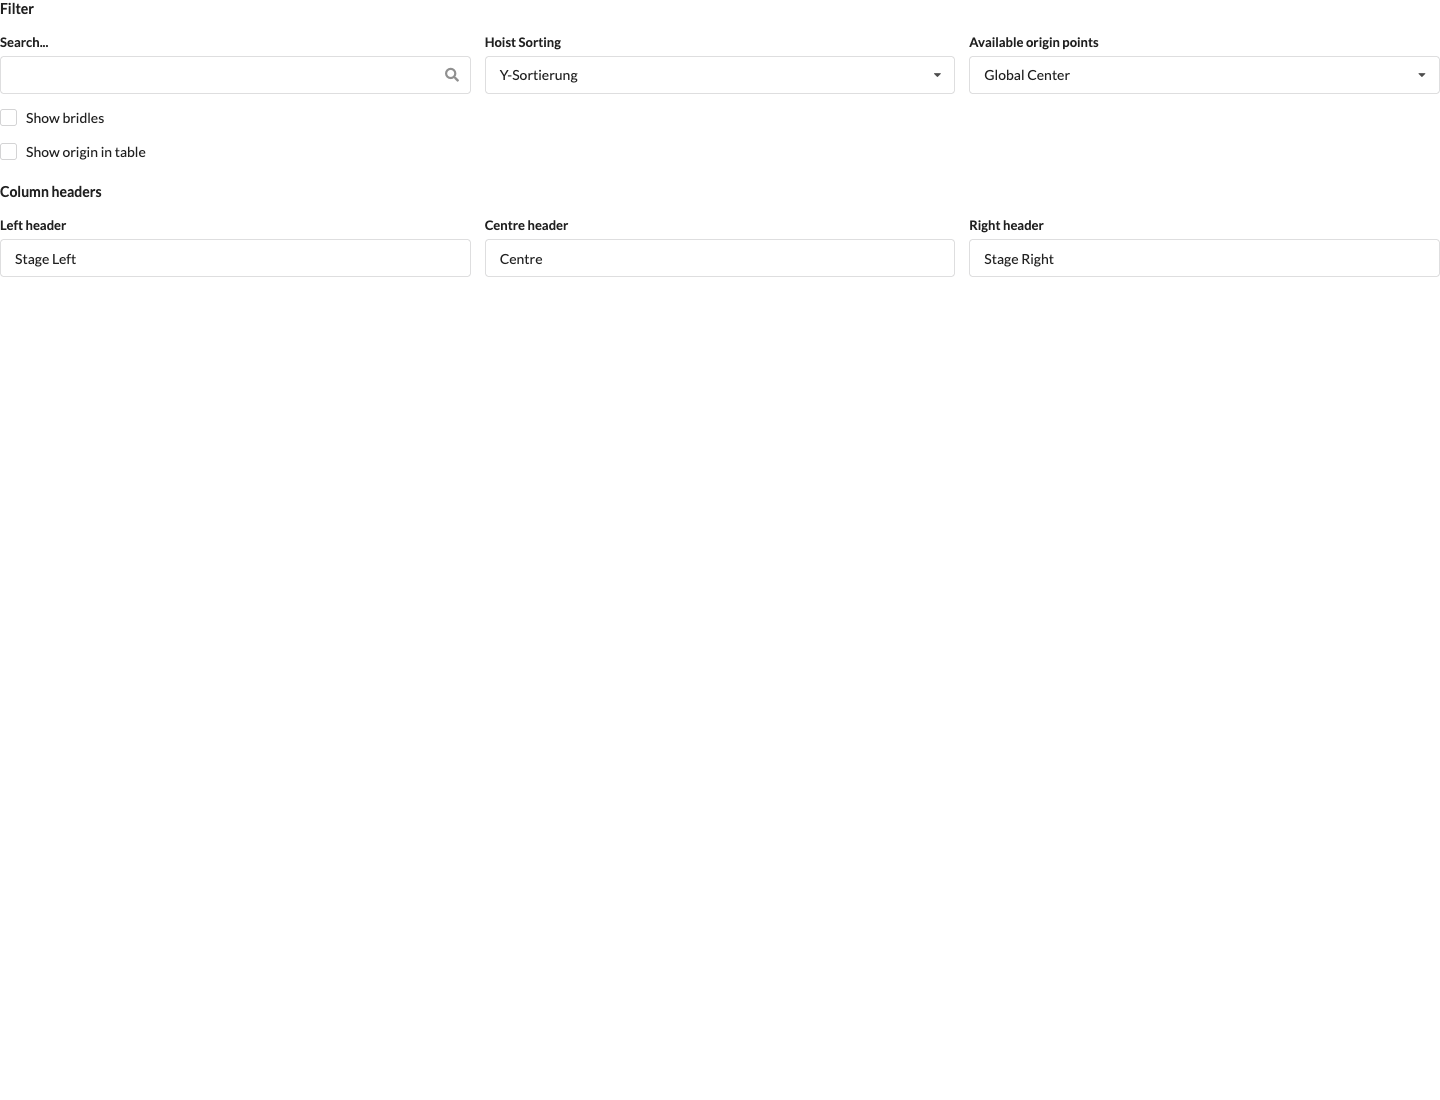
The search field narrows the numbered list. Rigging Equipment Sorting switches between the available sorting and route views. Available Origin Points also appears for Y-Sorted List; the selection sets the reference point for the display. The shown Drawing Origin selection uses the drawing origin. This filter selection does not change any rigging equipment values.
With Show bridles, you can show or hide bridles in the rigging equipment list. The switch is on by default and applies to all three sortings. In the Y-Sorted List, hiding them also removes rows and outer columns that no longer contain any supports. In both route lists, the distances still refer to the originally calculated route sequence, including hidden points.
To set custom headings in the Y-Sorted List, enter the text under Column headers for Left header, Centre header, and Right header, for example Stage Left, Centre, and Stage Right. The left and right headings each span all existing support columns on that side; the middle heading appears above the Y coordinate. A side with no supports has no heading. Empty fields remain unlabeled; if all three fields are empty, the header row is omitted.
The bridle switch and headings take effect immediately for the current drawing view or selected assembly sheet and are saved with its settings. They also apply to the PDF preview and PDF export of the rigging equipment list. Before exporting, check that the desired points and headings appear in the preview.
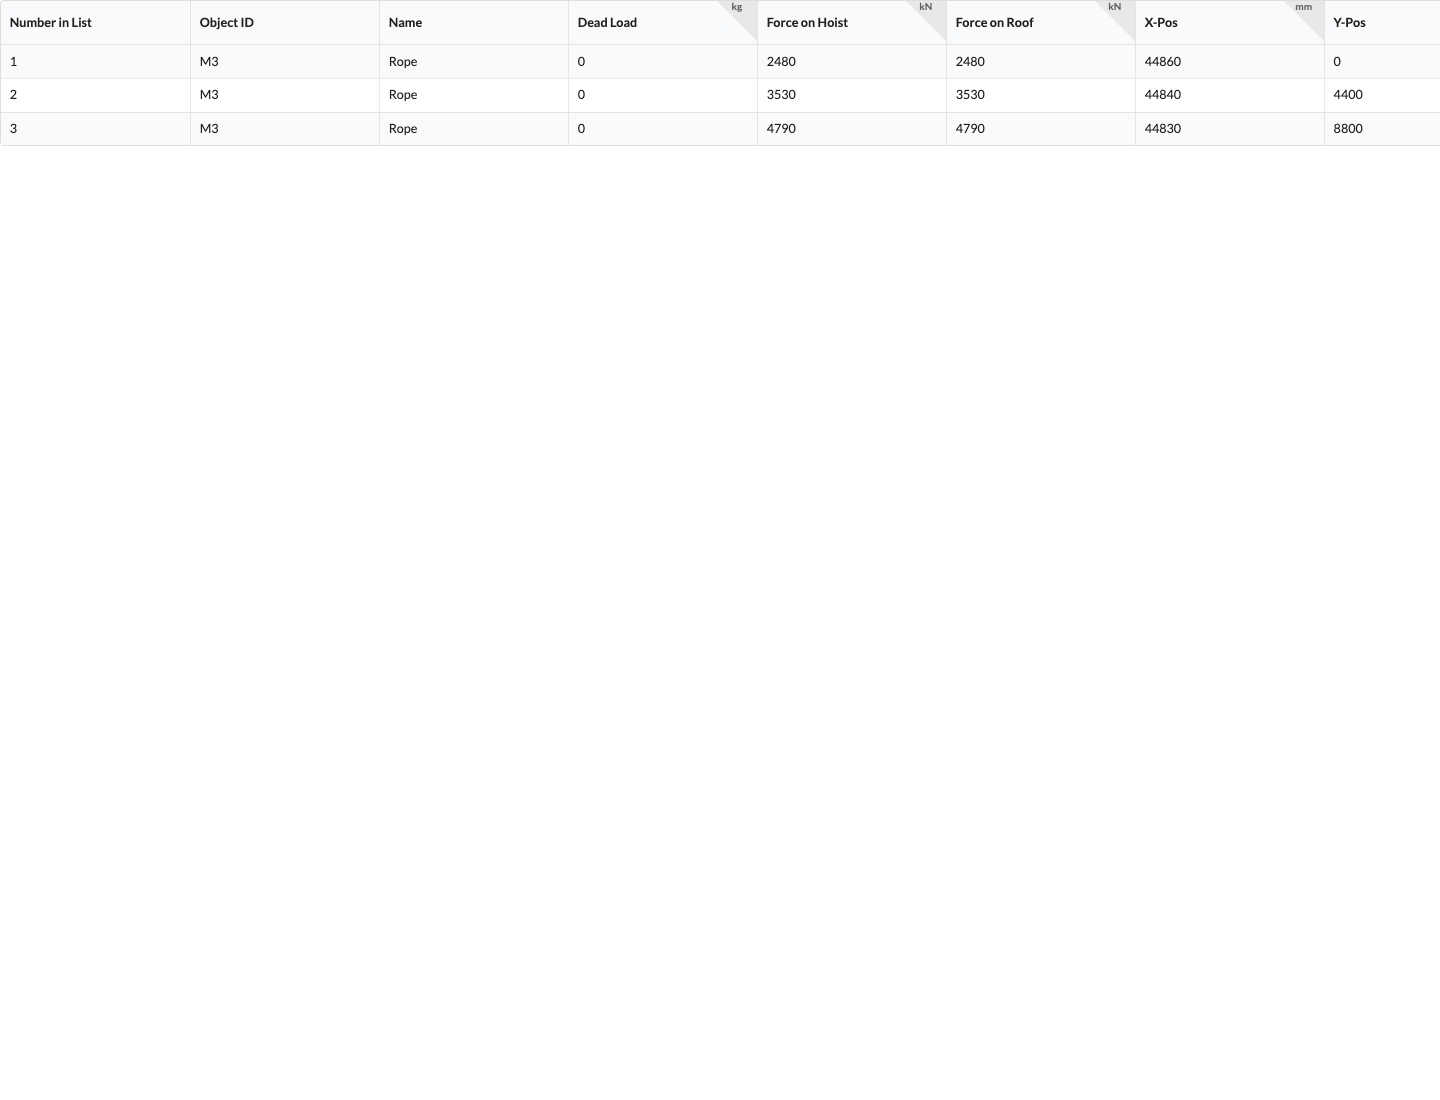
The table shows a numbered example view with the columns Number in List, Object ID, Name, Own Weight, Force at Motor, Force in Roof, X Position, and Y Position. The displayed values are examples; no editing buttons are visible in this view, and the forces and positions are for review.
Open the Transport view under Window → Worksheets to review trucks and their assigned cases and objects. For each truck, the list shows Volume, the Weight of assigned objects and cases, and Allowed Weight as the entered payload limit. Expand a truck using the arrow by its name to view its entries with volume and weight. The list also includes the standard container No Truck for material that has not been assigned; this does not represent an additional planned truck.
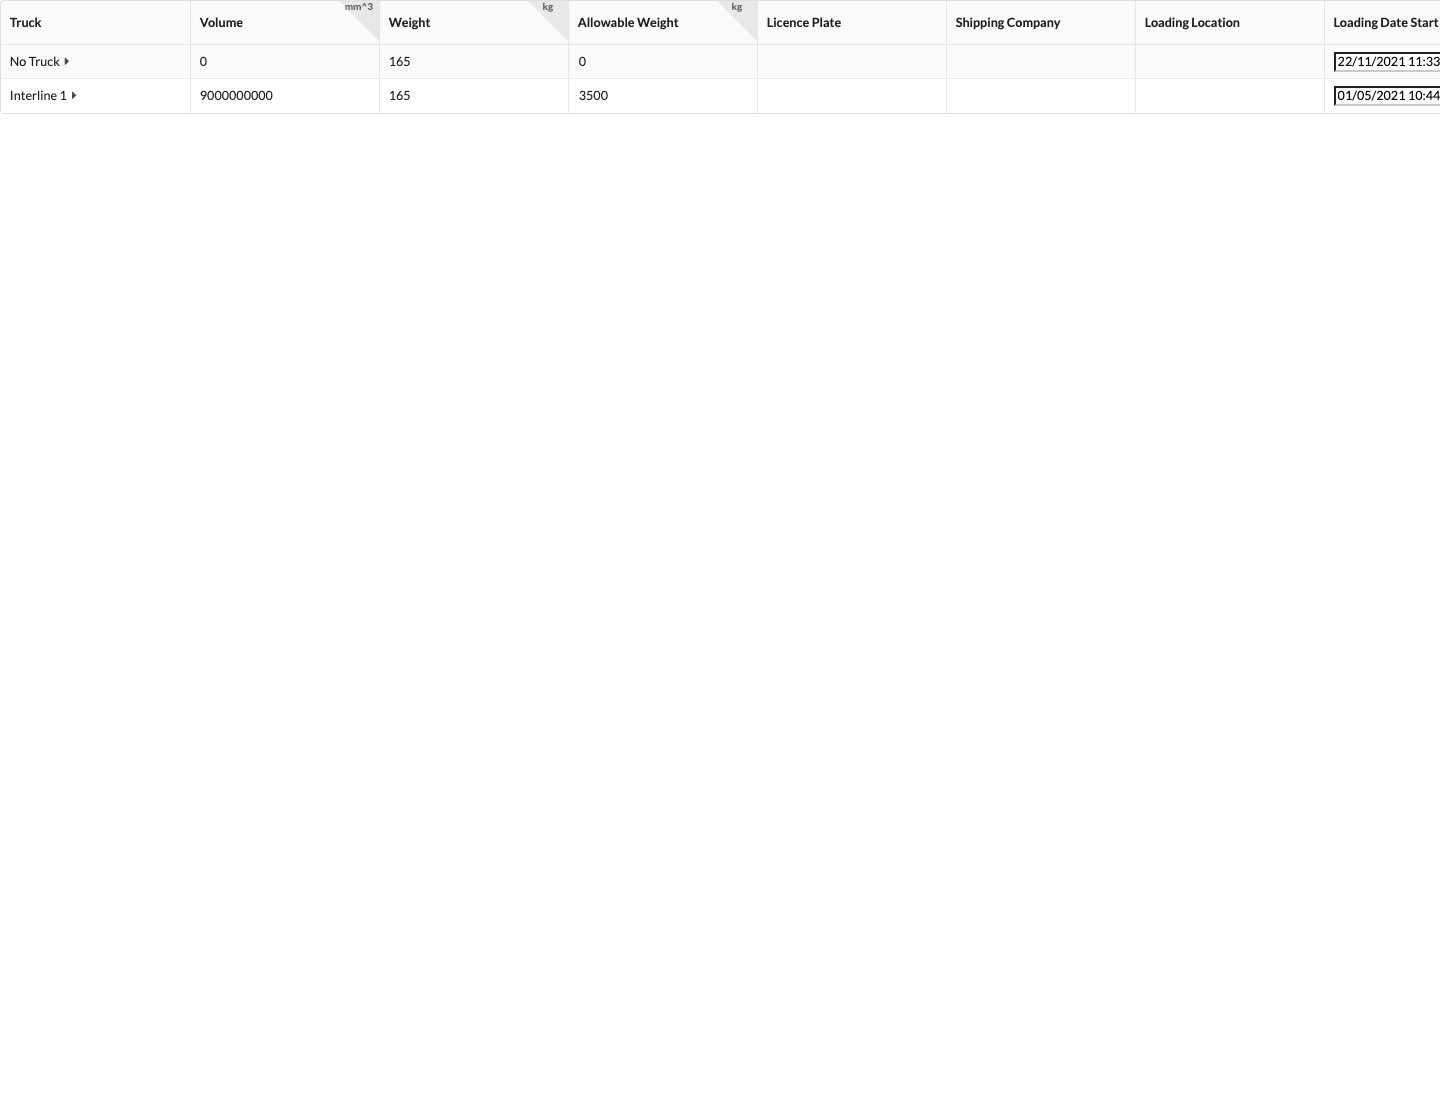
Create truck templates in the Resource Manager and trucks in the Containers tab in Navigation. Assign material using Linked Container. Then compare the displayed weight with the allowed weight; the list itself does not promise an automatic overload warning.
Show or hide the Worksheet window's filter bar using the funnel icon. The Transport list builds its truck entries from the drawing's container assignments; its search and property filters currently do not affect this list. If an object is missing, check its truck or case assignment in Object Properties.
When you select a truck's table row, the renderer on the right can show a schematic 3D view of the cargo space and loaded objects. The renderer must be visible, and 3D display must be available on your system. No Truck has no cargo-space view of its own.

This image shows only a gray renderer area; no truck, cargo, or controls can be identified in it. It therefore does not document a specific loading state. Select a truck row with assigned objects and show the renderer to review the spatial view.
Click a column heading to sort by that column. Click and drag the dividers to adjust column widths; drag and drop to change the column order.
Open Window → Worksheets and select the Cases view to review created cases and their contents. Each row shows the case name, the names of the included object types, the assembly group, Used Capacity, Capacity, and Weight. Used Capacity counts the included objects; Capacity is the sum of the quantities in the case template. The Weight shown here is the sum of the included objects, not the case's own weight.
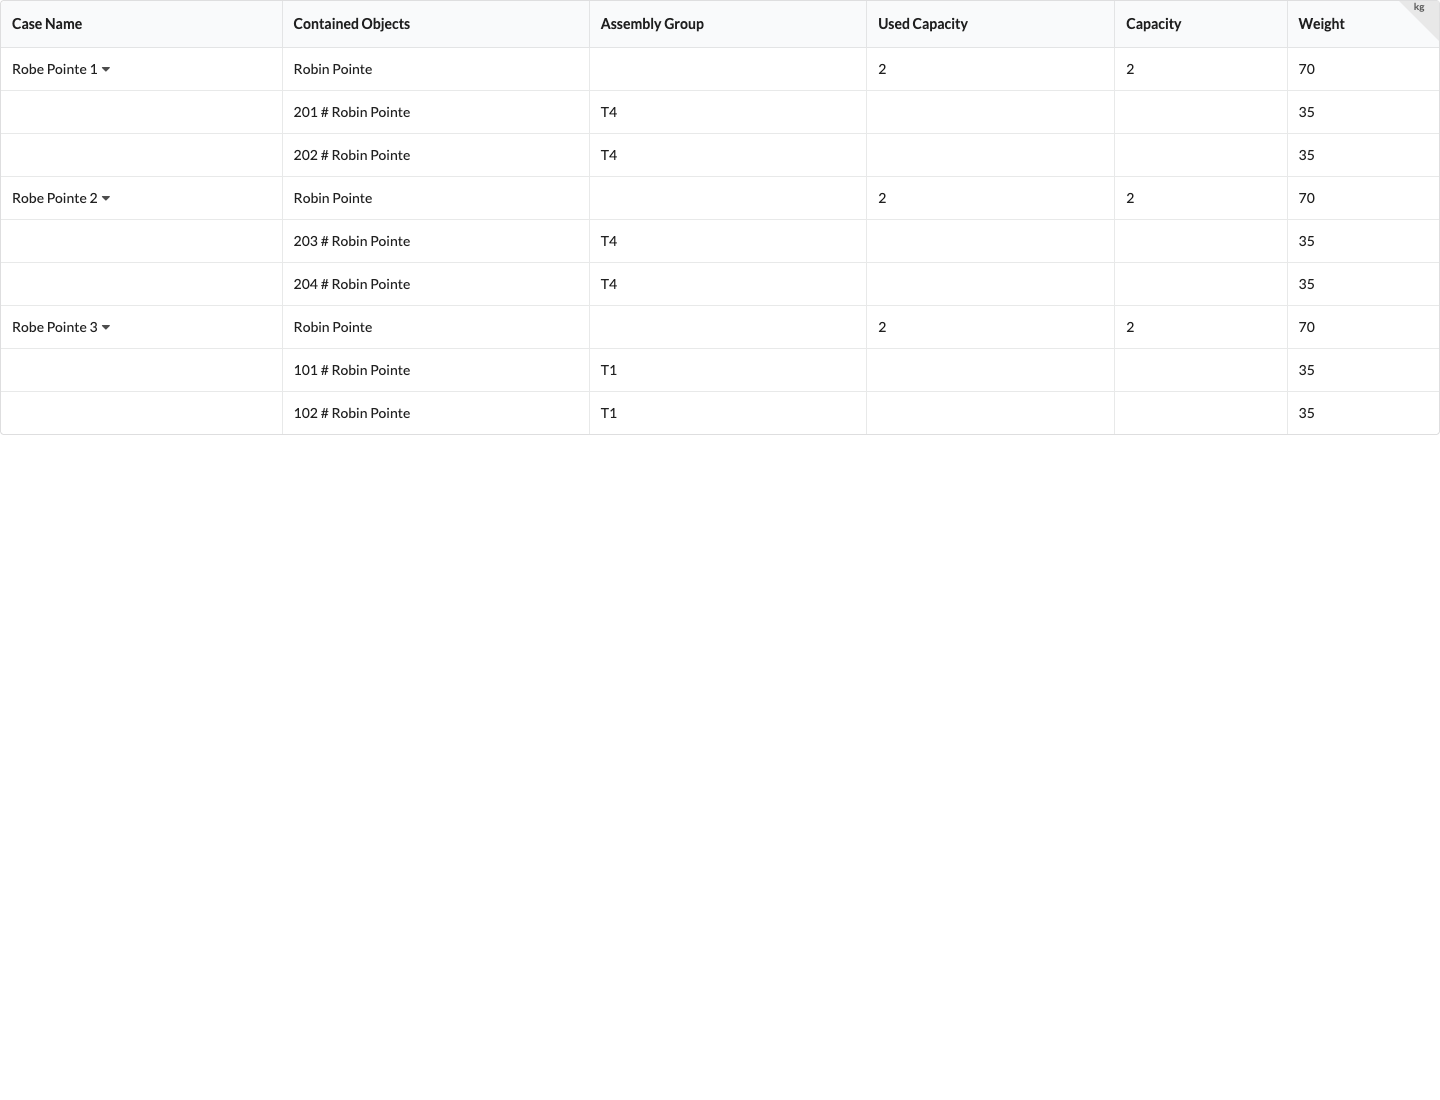
The case list is for review. Create and edit cases in Navigation; change the assignment of individual objects in their Object Properties.
Each of the three example rows contains two Robin Pointe fixtures weighing 35 kg each. The assignments to T4 and T1, as well as the case names, come from the replaced drawing.
Open Window → Worksheets and select the Racks view. Each rack shows its rack units (U) and the devices installed in it. The number before a device name is its installation position in U; a device can occupy multiple U.
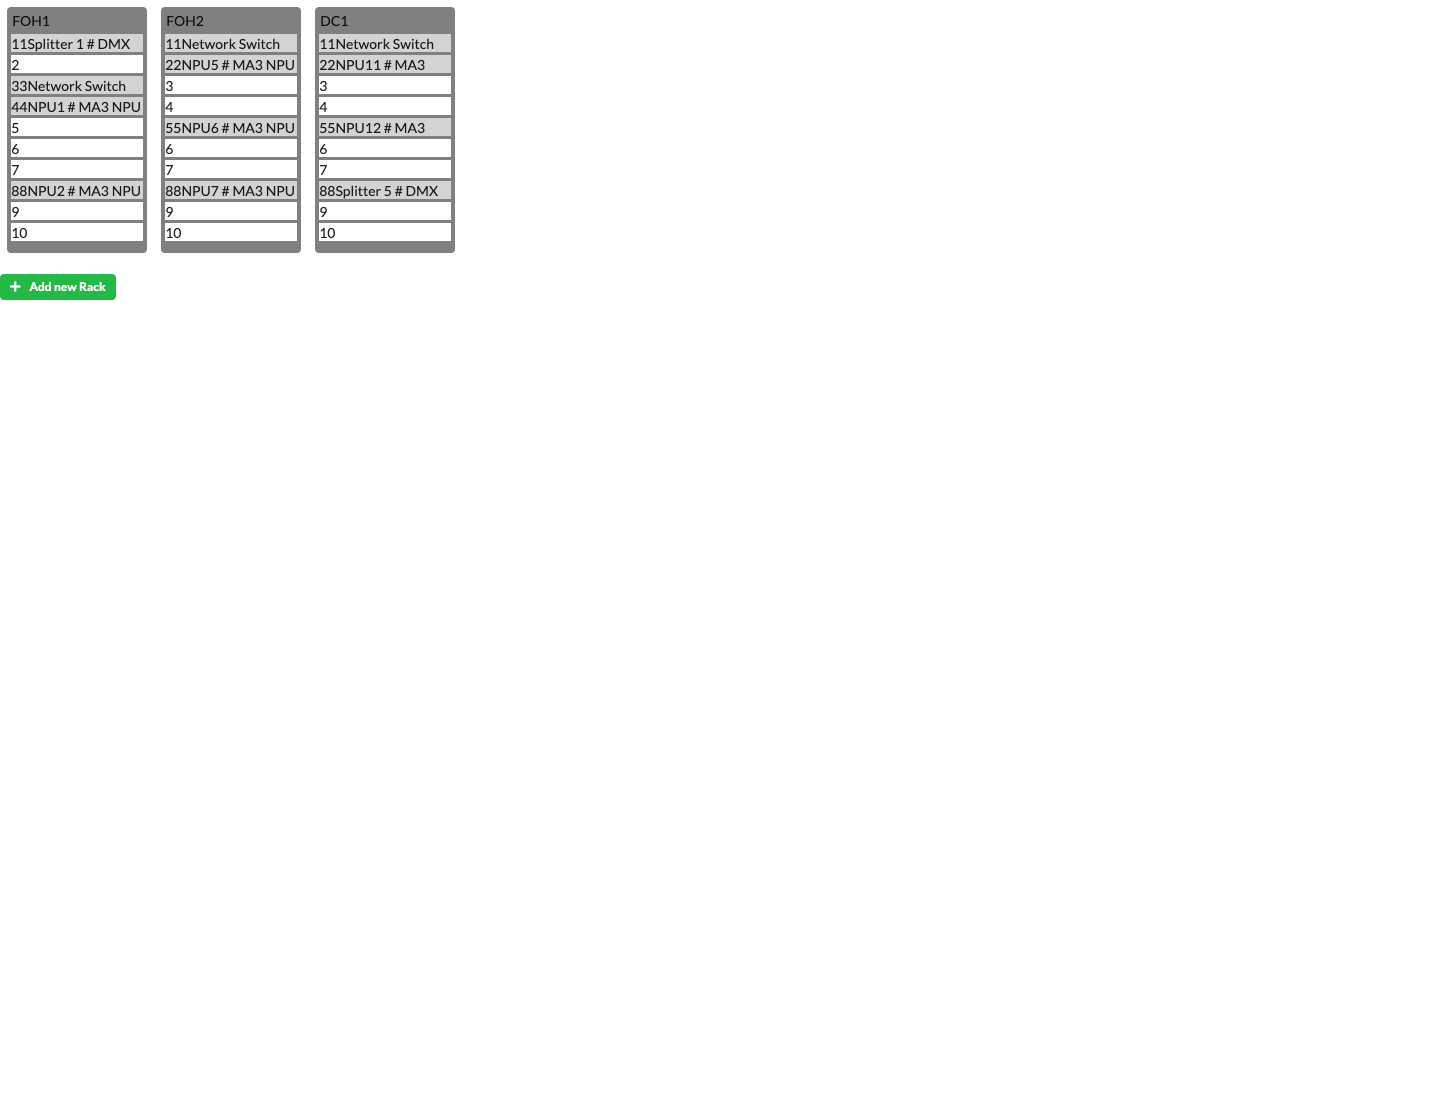
Use Add New Rack to create a rack directly from the worksheet view with the default Rack template. Navigation also lets you choose a template and edit the rack's size, number of rack units, and weight.
Rack-size templates are managed in the Resource Manager. If an expected device is missing from the rack view, check its rack assignment, Rack Units, and the selected worksheet view.
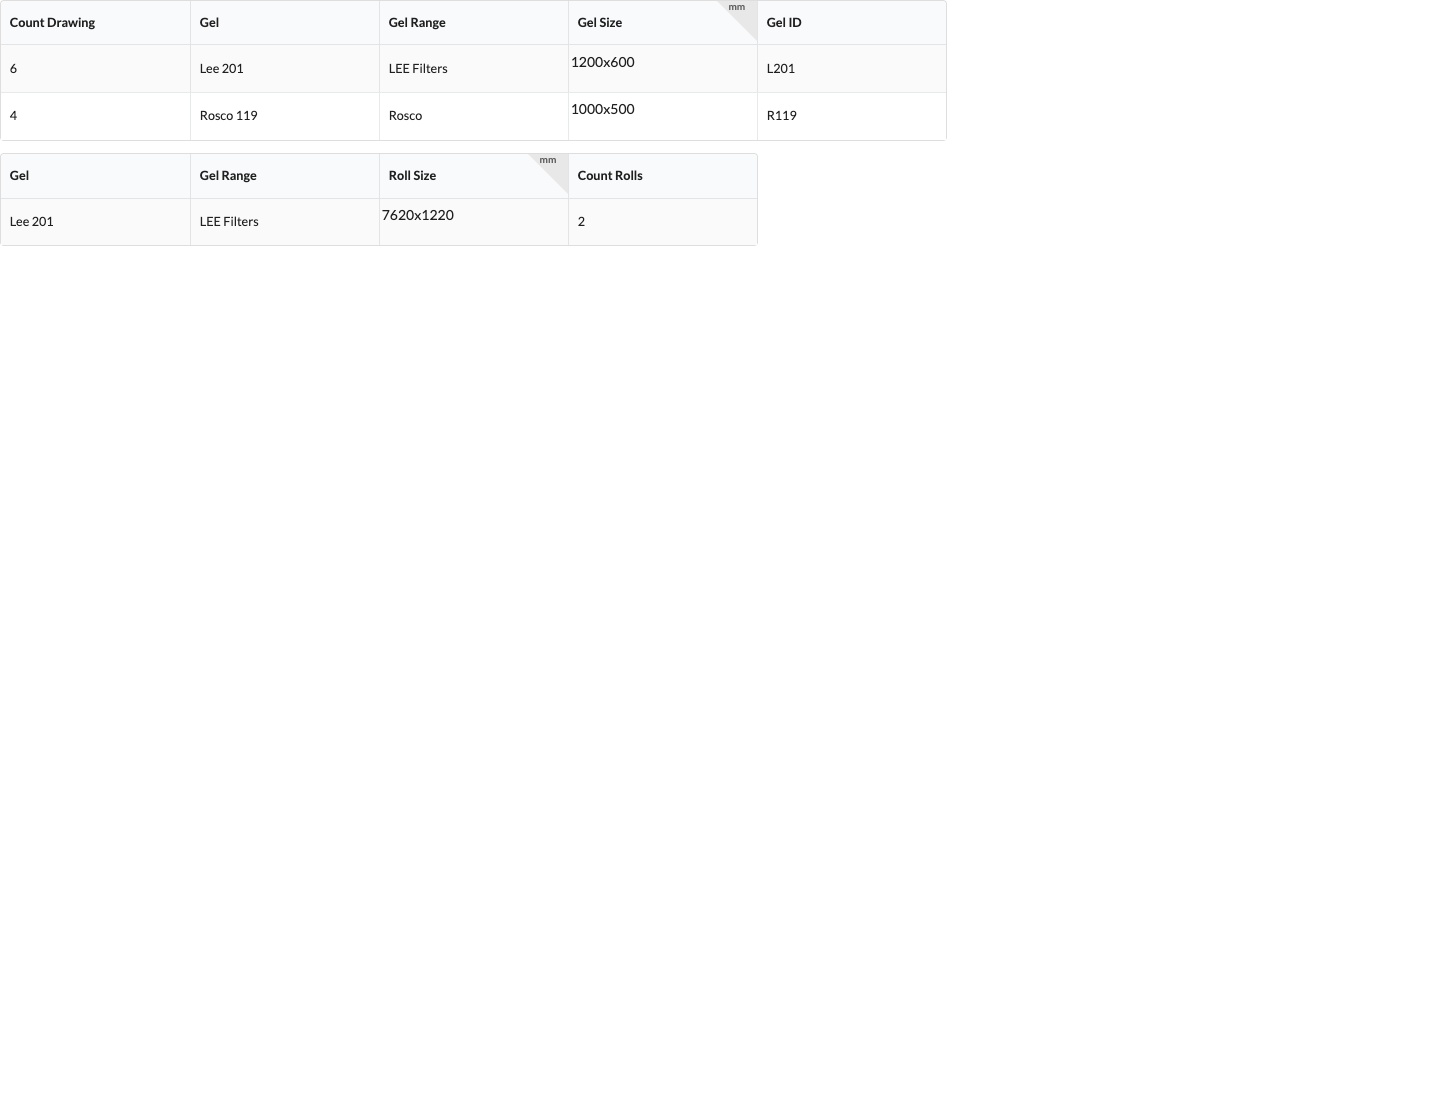
The Color Foils view helps you plan cuts and rolls for the color foils used in the drawing. Open Window → Worksheets and select Color Foils. If the tab is missing for an assembly sheet, enable Color Foils in its properties. Both tables show all fixtures in the active drawing; selecting an assembly sheet currently does not limit the color foil list to its objects.
The first table groups matching foils by Gel, Gel Area, Color Foil Size, and Color Foil Number. Drawing Quantity counts the corresponding uses in the fixtures. The size comes from the two frame dimensions of the respective light beam. The second table shows the Roll Size and calculated Number of Rolls for each combination of foil and area. The roll size is fixed at 7.62 × 1.22 m in the current calculation; the number of rolls is a planning value based on cut sizes, not an inventory figure.
The values in either table cannot be edited here. If a foil or cut is missing, select the fixture in the drawing and, for the relevant light beam, check Color Foil Series, Color Foil, Frame Size X, and Frame Size Y in Object Properties. A light beam without a foil name and foil area does not appear in the list. Then reopen the Color Foils view to check the calculated values.
Open Window → Worksheets, select Scene or an assembly sheet, and, if needed, enable the Electrical Overview view in its properties. The All Electrical Loads tab shows the loads and power sources for the selected view; you can also select individual power sources. The Show All Objects / Show Distributors Only toggle limits the available power-source tabs to designated distributors. By default, all eligible higher-level electrical objects are offered. Changing this setting does not change any connections.

The filter here contains only the Search... field with a magnifying-glass icon. The entered text narrows the electrical lists; this image does not show an additional menu or confirmation button.
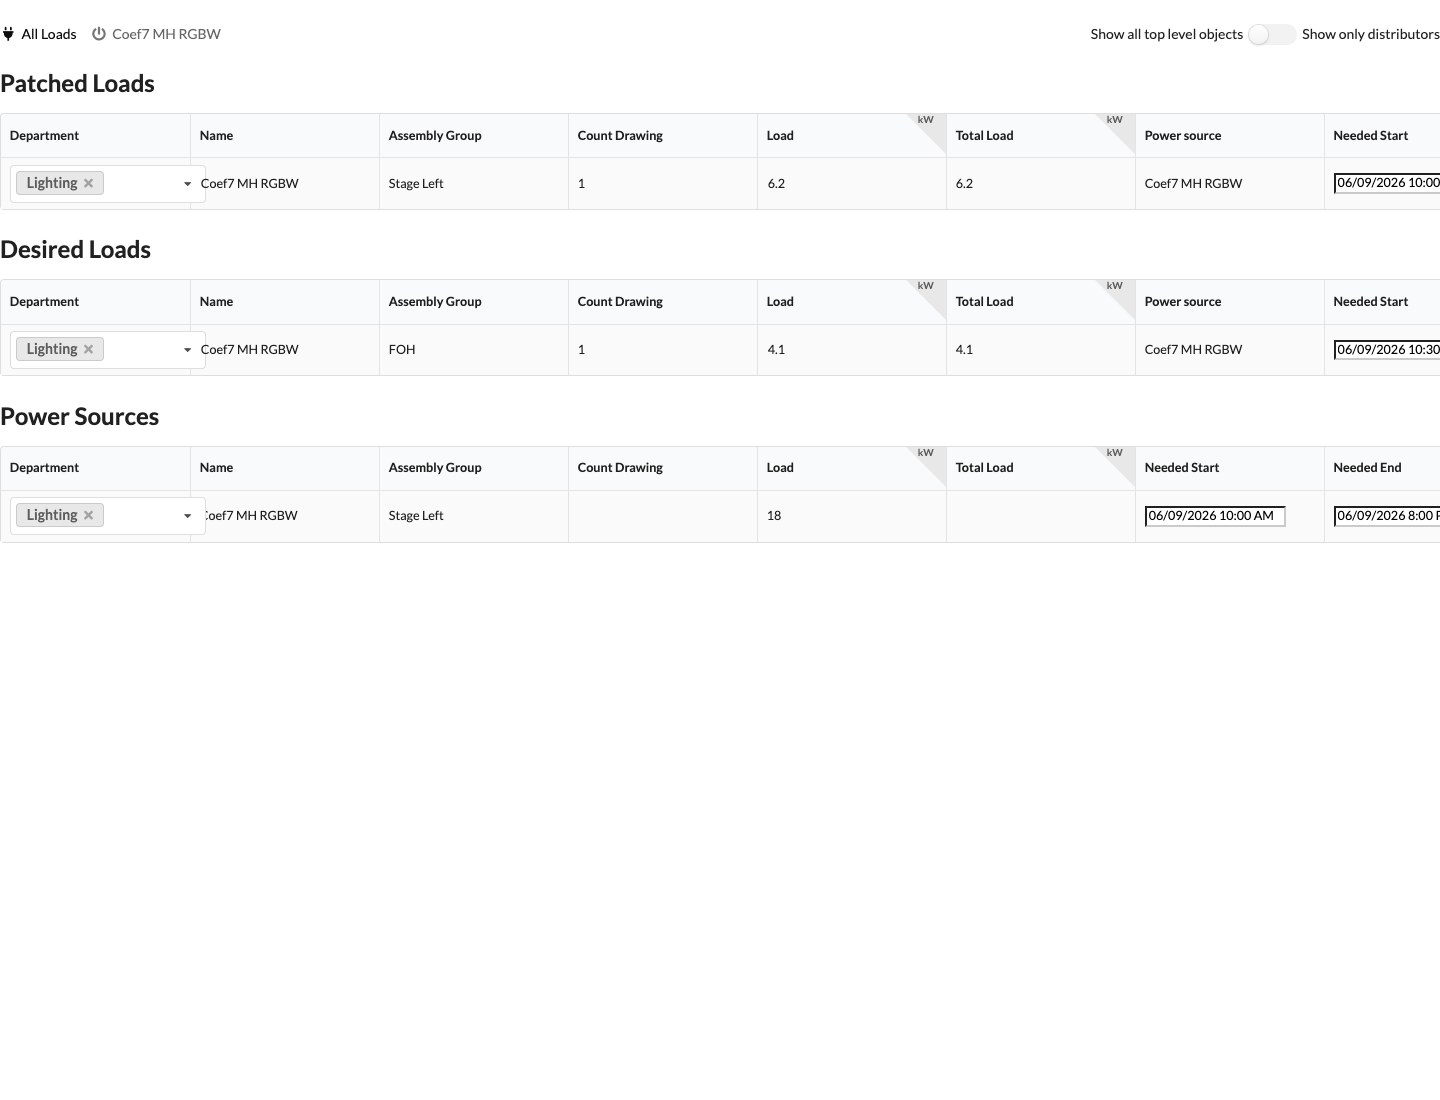
The image shows the Coef7 MH RGBW consumer from the replaced drawing. The fields and labels below were checked against the current interface.
Patched Loads are consumers that are already connected. Temporary Loads have not yet been wired, but have been assigned a Temporary House Connection in Object Properties. Without this assignment, they do not appear under the relevant power source. House Connections lists the power sources with their load and availability period. In All Electrical Loads, you can edit a consumer's department, name, consumption, and Required From and Required Until values; for power sources, you can edit the department and availability period. The name of a temporary load is currently not saved reliably through this table. Change it in the consumer's Object Properties, then check the list again. Quantity, total load, and calculated loads are display values. Changes to consumption affect the electrical geometry of the defining resource; if the symbol is used more than once, also check other devices of the same type. For more usage guidance, see Electrical Planning.
Open Window → Worksheets, select Scene or an assembly sheet, and, if needed, enable the Connections view. For each connection, the table shows, among other things, the connection type, From, To, assembly groups, cable type, fuse, house connection, cable length, and consumption. Click a connection cell to select the objects involved. You can change the assignment of the associated object in Department and Color Code. Cable length and consumption are display values; cable length cannot be set here.
Open Filter using the funnel icon and search for the connection name, object ID, or assembly group on either side of the connection. If a connection is missing, first clear the search, then check the connections and patching of both objects in Object Properties. For more guidance, see Electrical Planning.

The filter panel contains a Search... field with a magnifying-glass icon. It filters the connection data; no other filter controls are visible in this component image.
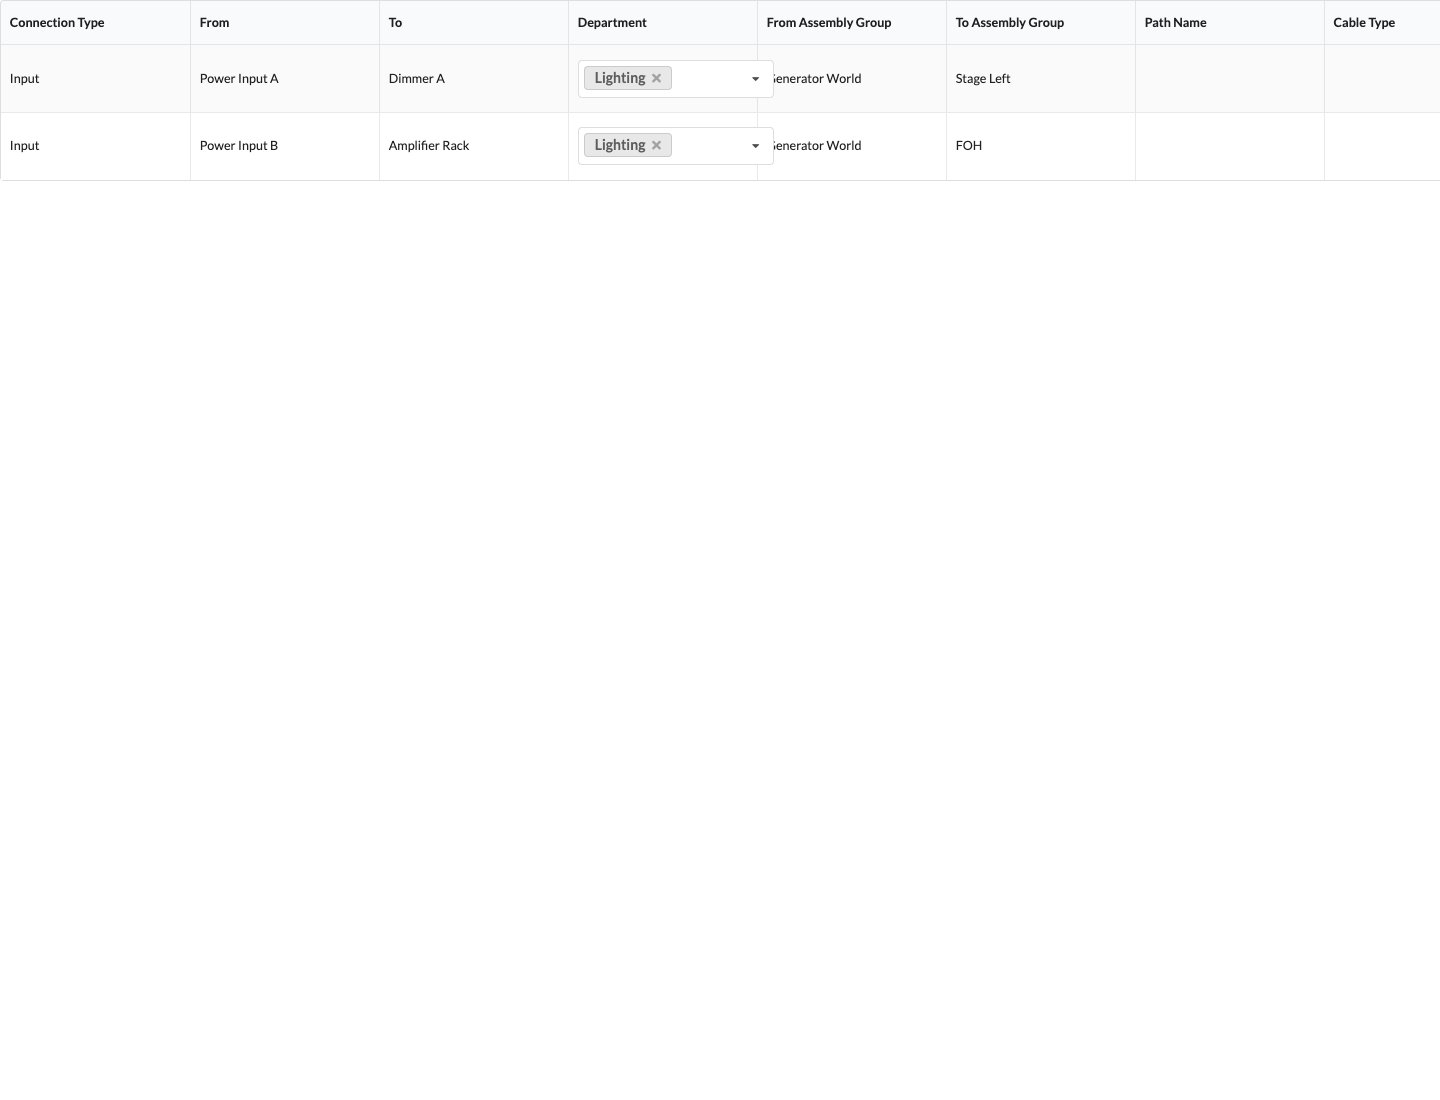
The rendered example shows test data and only the left-hand table columns. The available columns and controls depend on the worksheet and the connected objects.
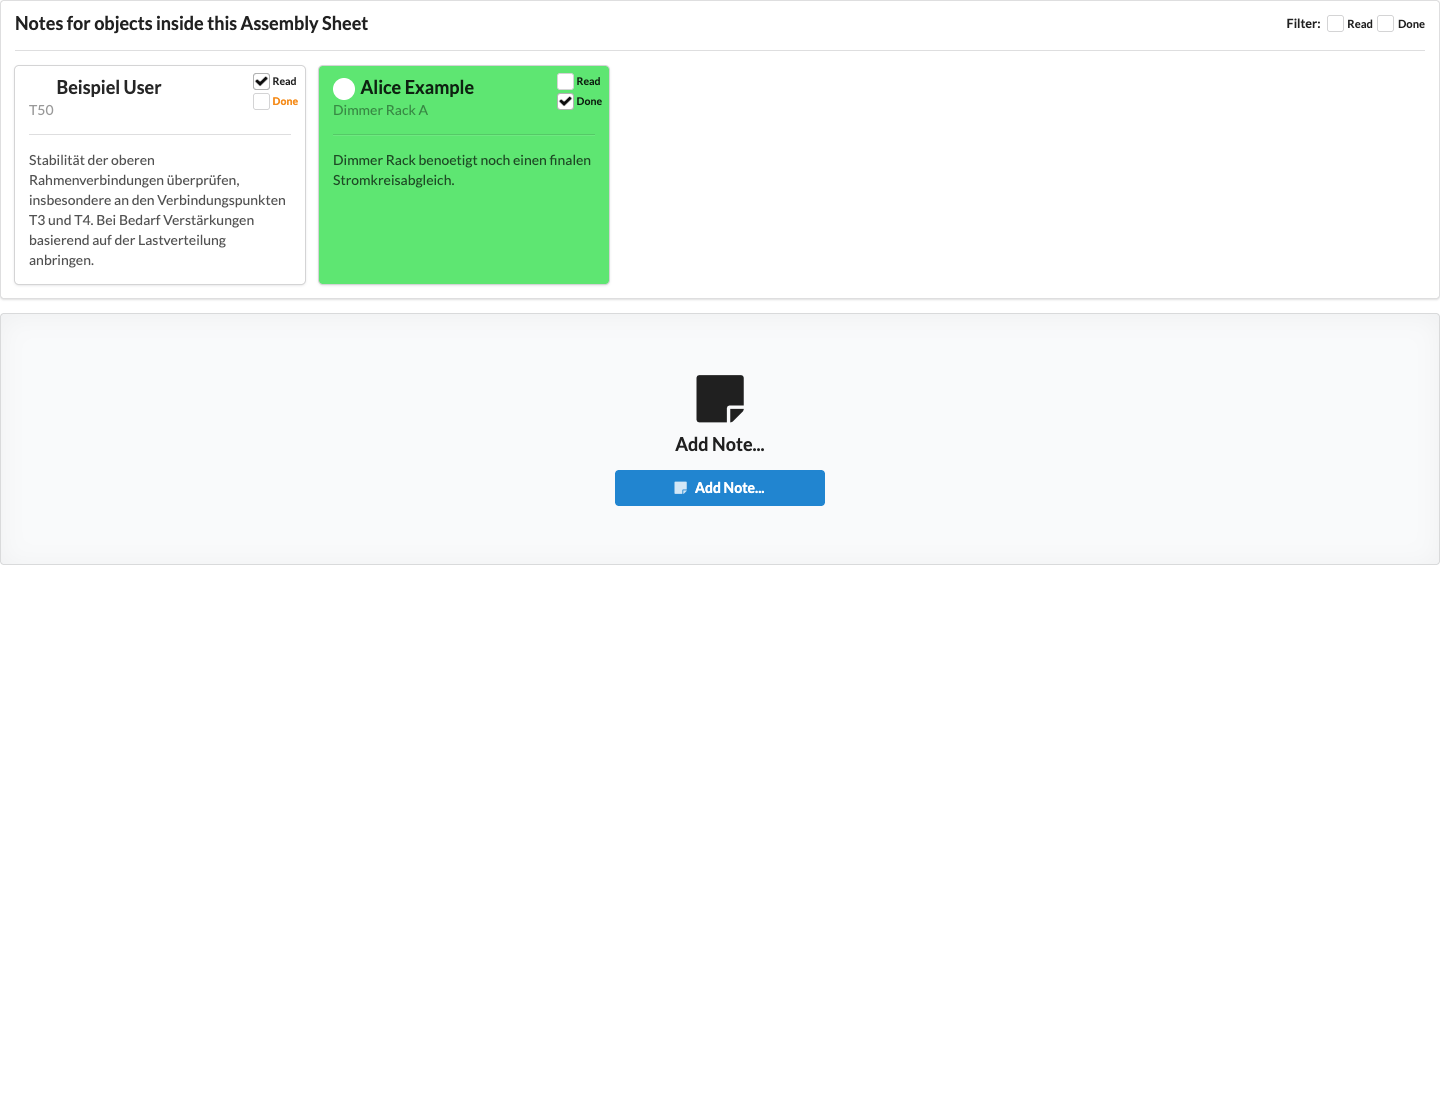
The Notes view shows notes for objects in the selected view. In the Worksheet Window, select Scene or an assembly sheet, then open Notes. If the tab is missing for an assembly sheet, enable it in that sheet's properties. Clicking a note card selects its associated object. Read marks the note as read for your user account. Completed marks it as completed for everyone; completed cards are green. These marks do not change the status of the assembly sheet task in the Task Overview.
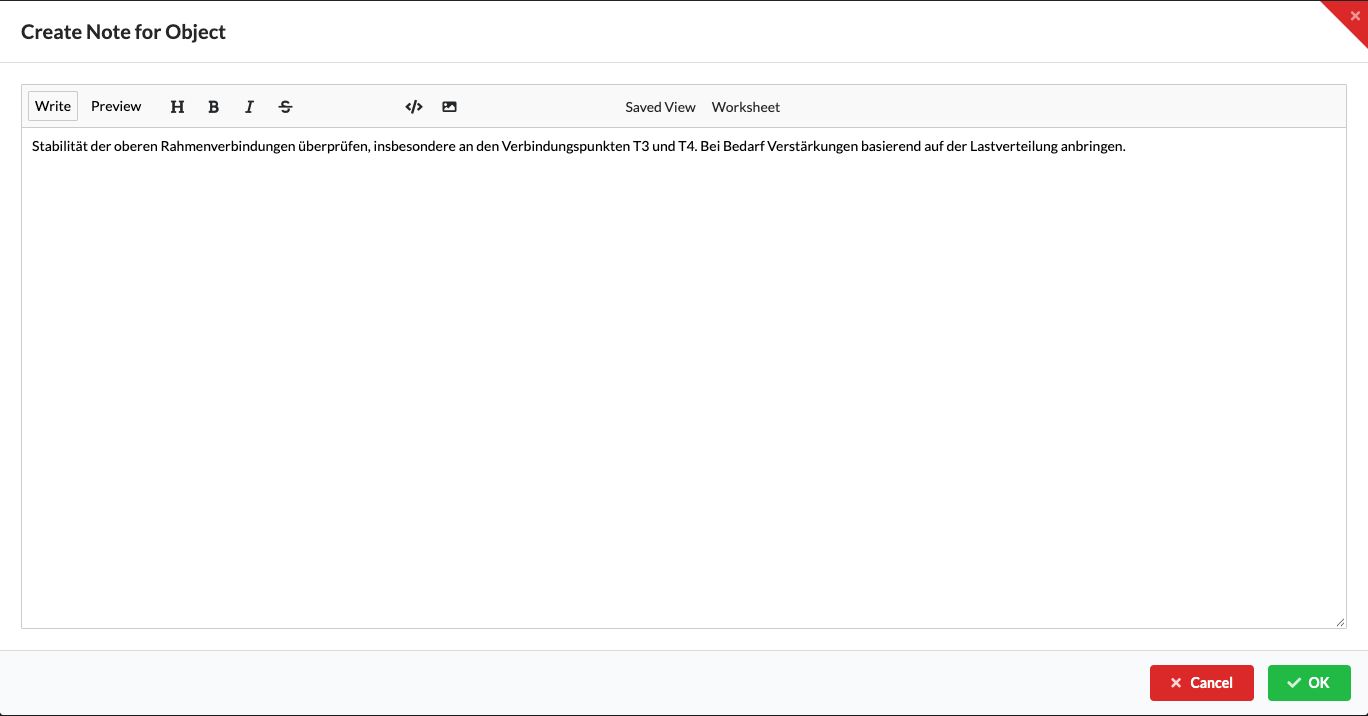
To create an object note from the Worksheet Window:
The Read and Completed filters are currently limited: when both are off, you see all loaded notes. Once you turn on a filter, only notes that you marked as Read remain visible; Completed further separates these into completed and open notes. As a result, an unread completed note may be hidden when the Completed filter is active. Turn both filters off to find it.
Open Window → Worksheets → Calculation Results after running the static calculation. The list shows calculation results, loads, wind loads, and errors for the entire drawing. Selecting an assembly sheet does not limit this results list to its objects, including when exporting it as a PDF. You can also open the same overview through Rigging → Show Calculation Overview.... The built-in calculation does not replace a reviewed structural calculation.
For a mobile overview, the iOS widget and paired Apple Watch show the latest calculation status saved on the PA server. Depending on its size, the iOS widget shows the highest utilization of trusses and chain hoists, as well as weight and forces; iOS determines when it updates. On the Watch face, the PA Live complication shows the highest truss and chain hoist utilization and the total weight. The active Watch app checks regularly for new results and updates immediately when reopened; you do not receive overload warnings in the background. The Watch shows the value and limit alongside utilization, separates chain hoist checks and truss profiles onto their own pages, and opens the associated truss checks through the profile circle. Entries from Loads in Calculation remain on the ALL LOADS page. Continue to check the complete results and errors in the Calculation Overview.
The groups Rigging Points, Chain Hoists, Drops, Bridle, Cross Sections, and Ground Supports show their respective verifications. Cross Sections are also grouped by cross-section designation, such as HD34 or HD44. Each bar shows the highest utilization in its group; individual rows can contain different forces, moments, or other verifications with their corresponding units. By default, the thresholds are 80% for elevated utilization and 100% for overload. The active load combination may specify different thresholds. The column icon shows or hides columns in the results, load, and wind tables; Reset Columns restores their selection. At least one column remains visible.
Order Verified Statics... opens a request for an external review. The displayed price is loaded separately; the button itself does not mean that the request has been completed.
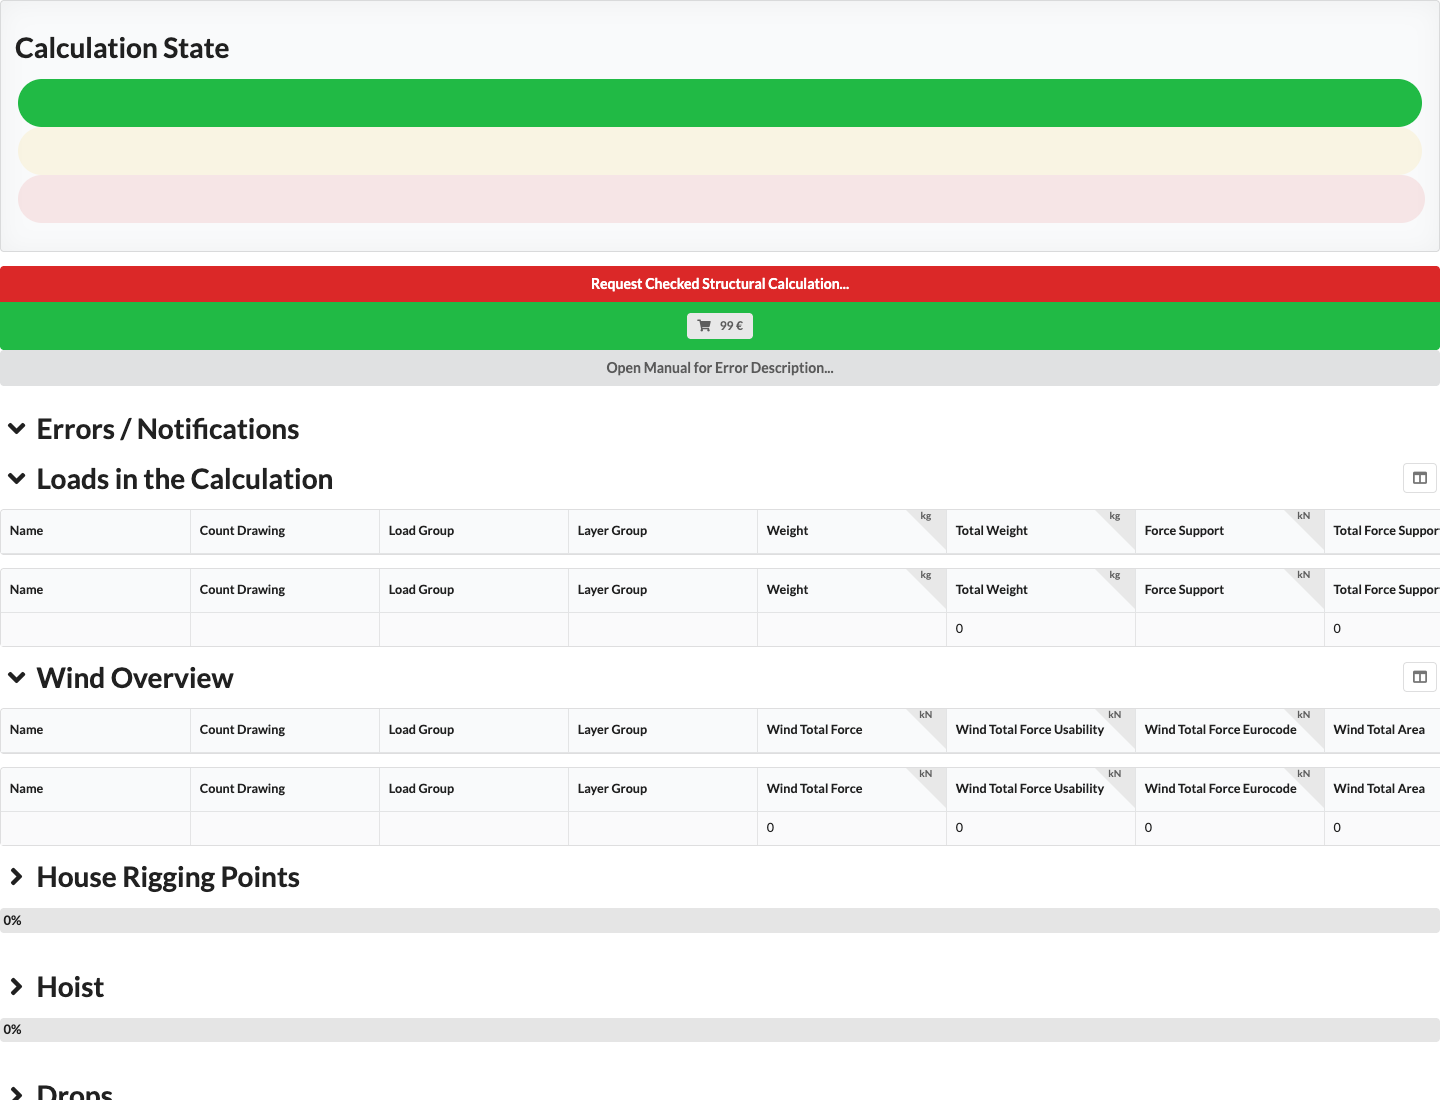
The replaced drawing contained the error groups FEM NODES, FRAMES INTERSECTING, and LOAD NO WEIGHT, as well as verifications grouped by cross section for HD34 and HD44. The UI Renderer image shows the current table view; it does not run a static calculation.
The Chain Shorten Effect as Comparison and Chain Shorten Effect of Utilization charts appear when rope supports are present. They show the effects of a calculated chain shortening on support force and the highest structural utilization. The labels on the horizontal axis identify the object and rope geometry; they are not length measurements.
In the comparison chart, the calculation relates the changed support force and the highest structural utilization to their initial states. 100% on a comparison curve means no relative change. The second chart shows the calculated utilization of the support and structure after the simulated change. The green and blue curves represent the structure and support, respectively. The charts do not measure actual chain length. They may be empty if there are no suitable rope supports or calculation values.
The charts depend on existing supports and a completed calculation. The UI Renderer displays the dialog and table components but does not calculate chain-shortening charts.
Open Window → Worksheets and select Summary to review drawing metrics. Inventory shows the number of trucks created, excluding the standard truck, as well as calculated storage and utilization values. Show counts presets and timeline steps. These two sections refer to the entire drawing, even when an assembly sheet is selected.
By contrast, DMX, Rigging Equipment, and Power Requirements refer to objects in the selected view. Select Scene for the drawing or an assembly sheet for its objects. DMX Parameters adds up the footprints of addressed fixture connections; DMX Universes counts the universes used, and Fixtures counts all fixtures in the view. Rigging Equipment shows object weight, the sum of reaction forces, and the number of support geometries. Power Requirements adds up the power of power sources and consumers separately. If a value is unexpectedly missing, first check the selected assembly sheet, DMX addresses, connections, and object assignment. The overview does not change these values.
In the Worksheet view, open Summary, expand DMX, and click Show Table to open the full-screen DMX Overview dialog. Under Console Parameters and NPU Parameters, you can change the Quantity for the example devices shown. Total multiplies this quantity, as an integer, by the displayed parameter count; the sum of the NPU parameters appears below. In Summary Overview, the dialog compares the calculated minimum and maximum with the drawing's Current DMX Parameters. Click OK or the red close icon to close the dialog. The device models and parameter counts are fixed; entries apply only in the dialog and are not saved in the drawing.
Note the limitation of the Verification: for consoles, the maximum calculation does not account for the entered Quantity; it uses the highest individual parameter value instead. The minimum is based on the lowest parameter value; however, if the quantities for both Grand MA2 onPC CMD and Grand MA2 onPC Fader are 0, it uses 4096 instead. NPU quantities are included in their sum. In addition, the German interface shows the same text, OK, for both states of the maximum check. Do not use the displayed Verification alone as capacity approval. Check actual usage in Window → DMX Overview and check your console's technical limits separately.
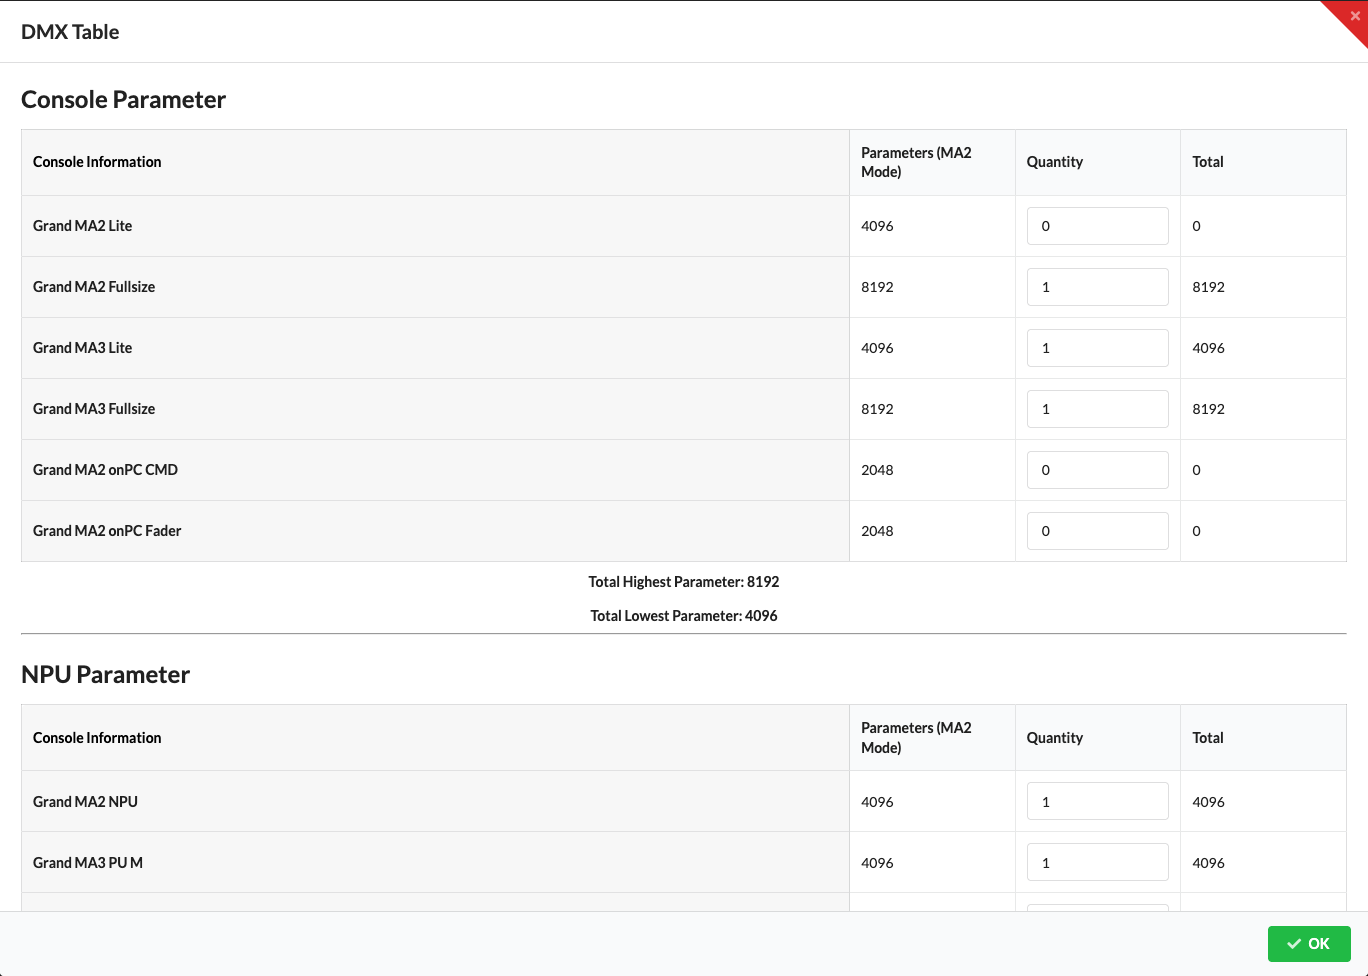
The example image shows the preset quantities, not a console configuration taken from the drawing.
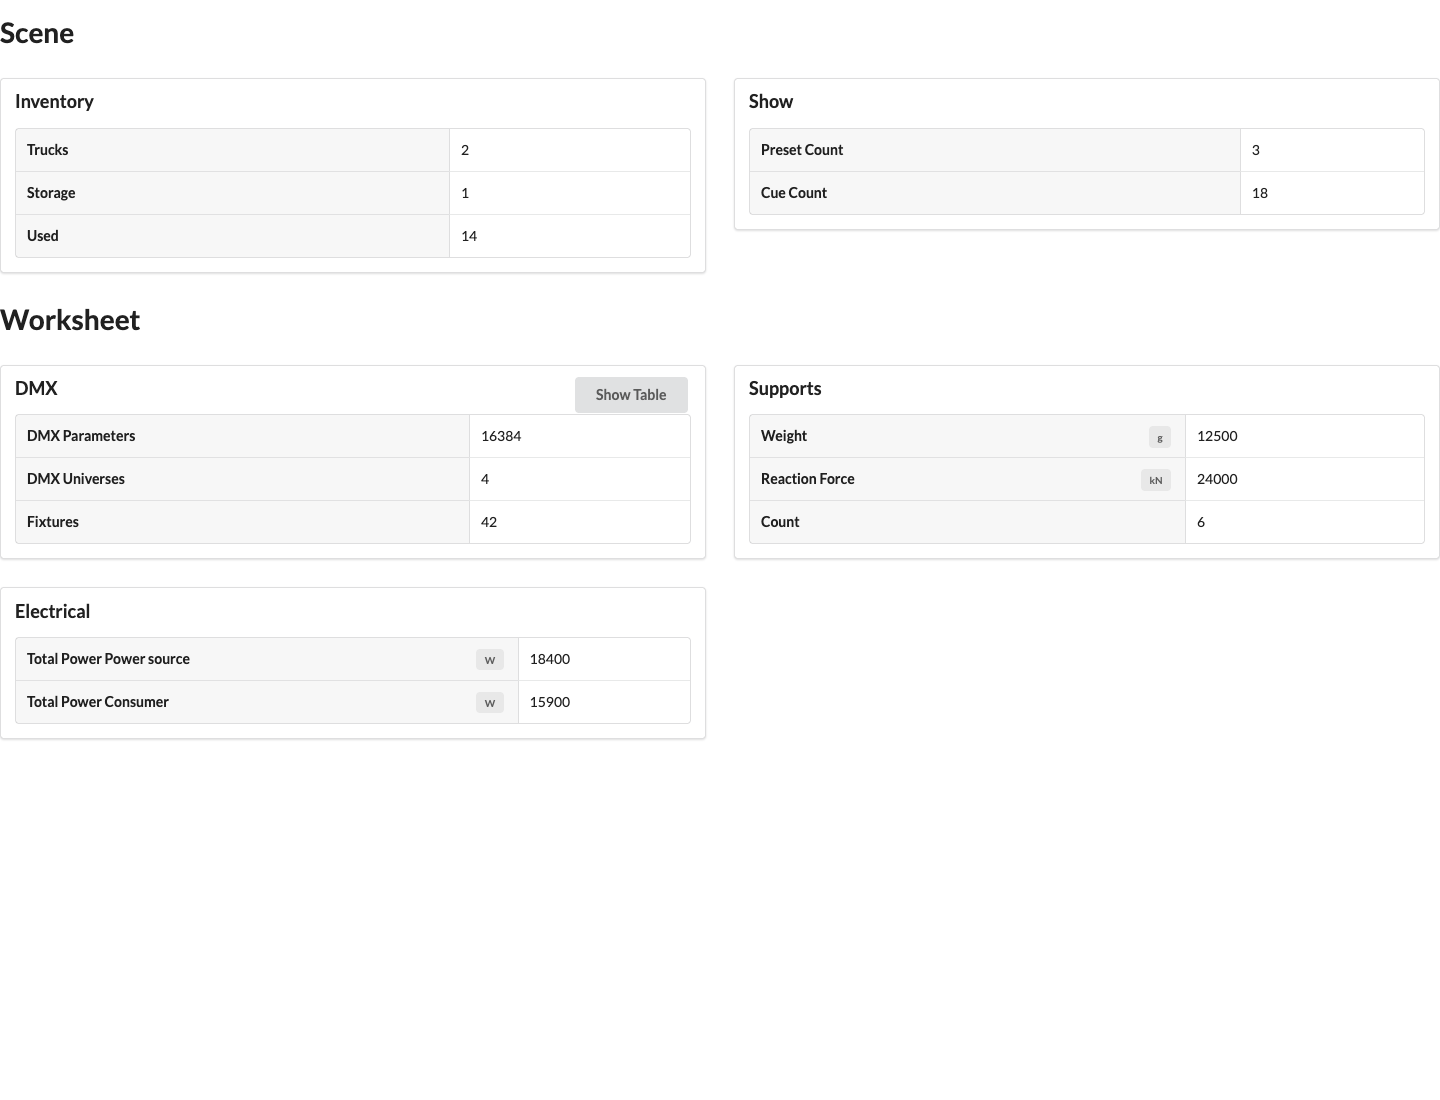
Use PDF to export the currently selected Worksheet view. First select Scene or the desired assembly sheet and check the visible table. The settings in the export dialog control the output of this view.
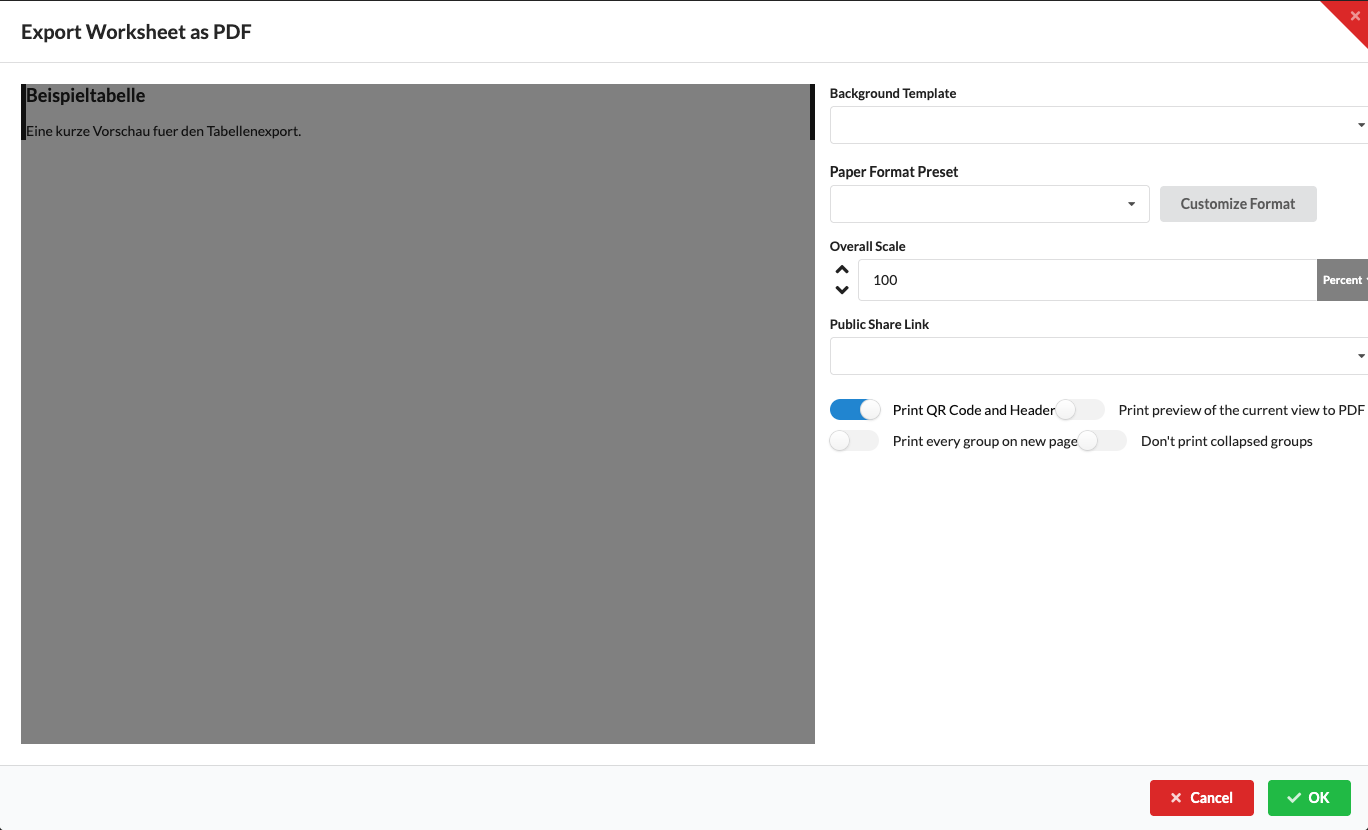
The gray area is a neutral preview fixture. In the Worksheet Window, the dialog shows a preview of the selected table.
| Name | Description |
|---|---|
| Background Template | Selects |
| Paper Templates | Selects an existing paper format for the current export. |
| Custom Format Settings... | Opens Custom PDF Format Settings for page dimensions and text and table formatting. |
| Scaling | Changes the size of the table output in the PDF. |
| Public Link for Sharing | For an online project, select an existing sharing link or create a new one. People with the link can view the online project; without a sharing link, they need access to the project. |
| Print QR Code and Header | Enabled the first time the export dialog opens; adds a header and QR code. The online link in the QR code requires a linked project; access is determined by the selected sharing link. |
| Print Preview of Current View as PDF | If a renderer is available, adds an image of the current view before the table. |
| Print Each Group on a New Page | Adds page breaks between groups in the grouped Properties table. |
| Do Not Print Minimized Groups | When enabled, hides the headings of collapsed groups in the Properties table during PDF export. |
| Cancel | Cancels the operation and closes the window. |
| OK | Confirms the selection and starts the PDF export. |
In the PDF export dialog, click Custom Format Settings... to adjust the selected paper format. In the format dialog, you can select and change an existing template, save it with Update Template, save it as a new template with Create Template, or select it for future exports with Set as Default. Check the updated preview before exporting. OK first closes only the format dialog; start the PDF export by clicking OK in the parent dialog.
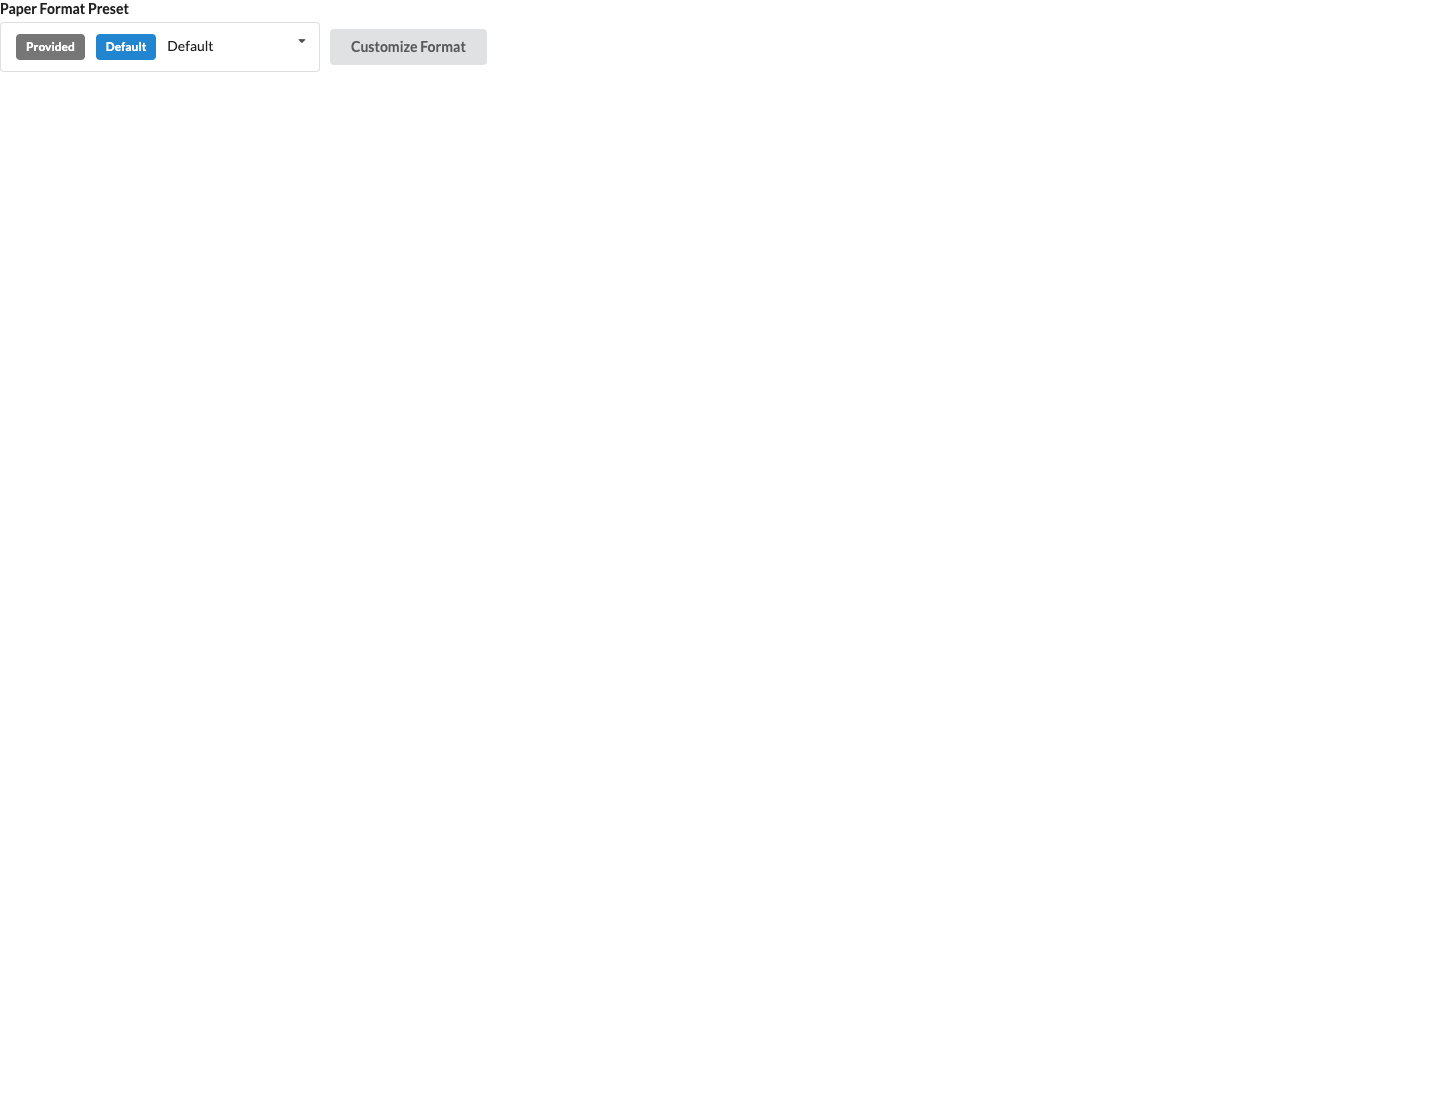
The format settings use the same PrintSettings view as the global print settings. The following UI Renderer images show the expanded Format Definition and Table Definition sections.
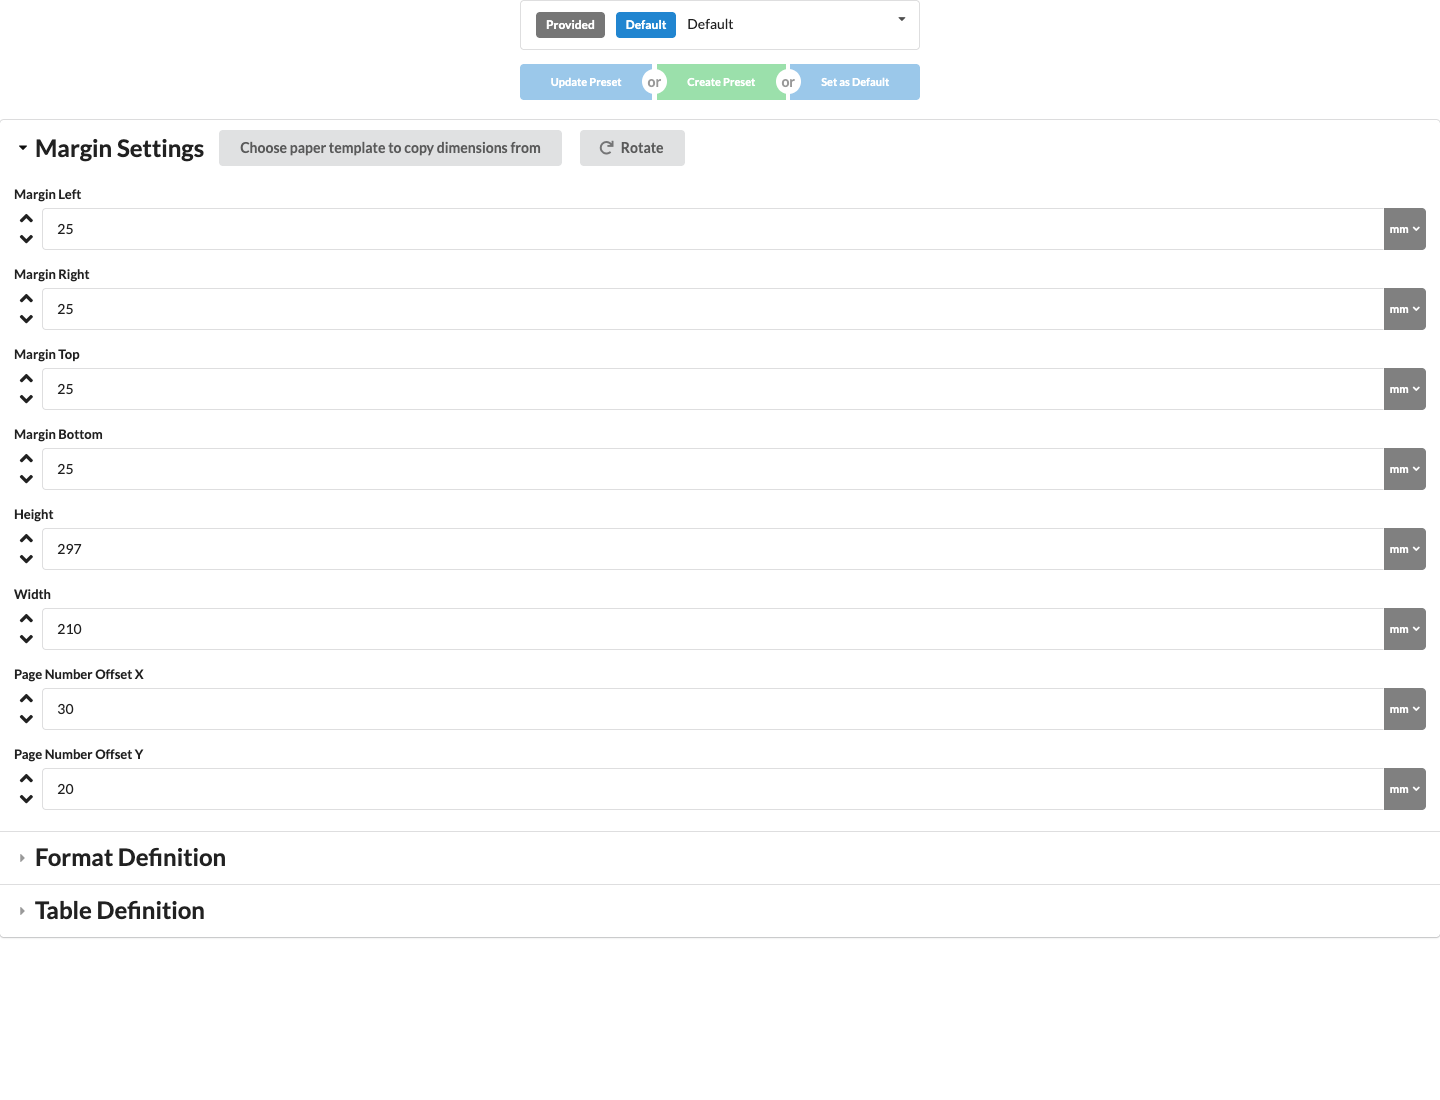
The image shows the current component, but not the surrounding Custom PDF Format Settings dialog.
| Name | Description |
|---|---|
| Update Template | Saves changes to the current template. |
| Create Template | Creates a new custom template. |
| Set as Default | Sets the current template as the default for future exports. |
| Select a Paper Template to Copy Size | Copies page dimensions and margins from an existing paper template. |
| Rotate | Swaps the page height and width and the margin positions for portrait or landscape orientation. |
| Margin Settings | Adjusts the PDF page margins. |
| Left Margin | Sets the left page margin. |
| Right Margin | Sets the right page margin. |
| Top Margin | Sets the top page margin. |
| Bottom Margin | Sets the bottom page margin. |
| Height | Defines the height of the PDF page. |
| Width | Defines the width of the PDF page. |
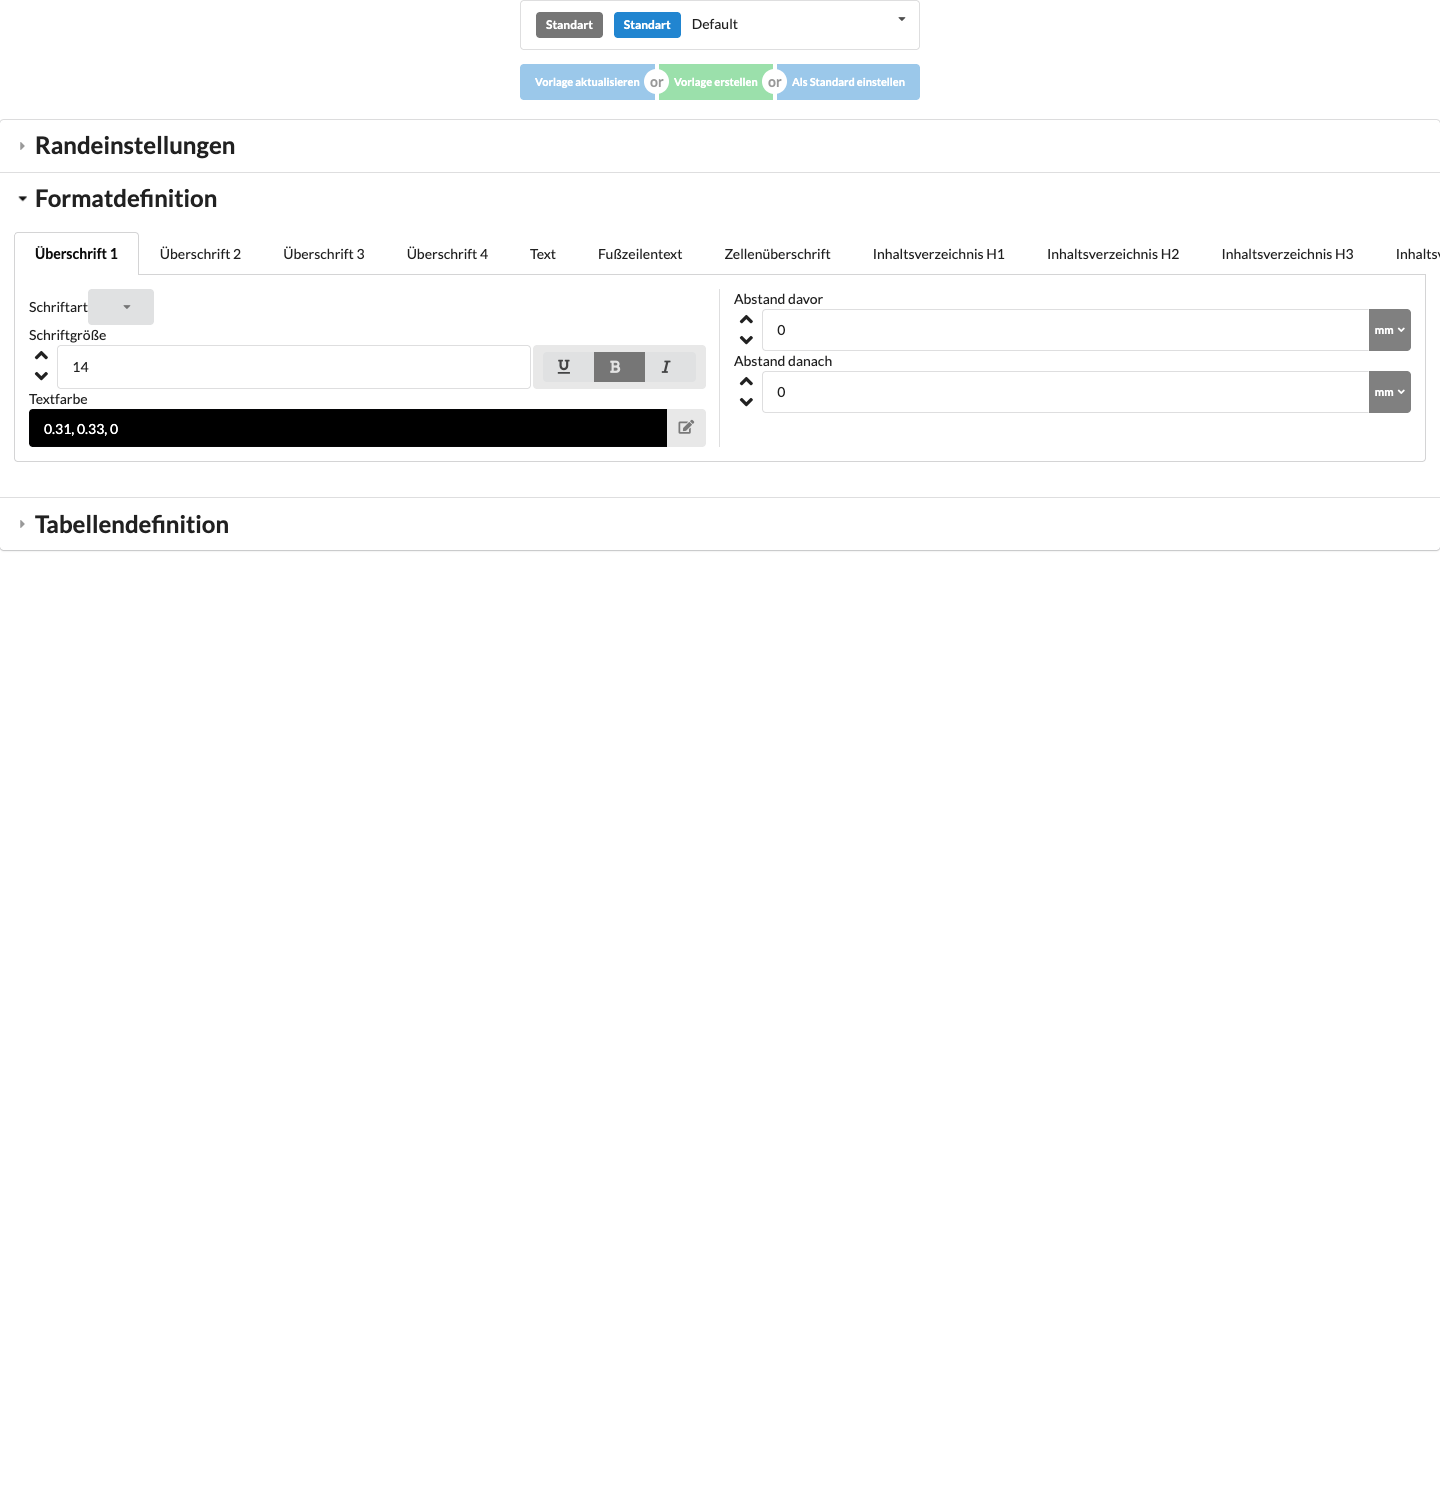
| Name | Description |
|---|---|
| Format Definition | Expands the paper format settings. |
| Font | Selects the font for PDF text. |
| Font Size | Sets the font size. |
| Text Style (B/U/I) | Formats text as bold (B), underlined (U), or italic (I). |
| Text Color | Sets the color of the text in the PDF. |
| Space Before | Sets the space above an element. |
| Space After | Sets the space below an element. |
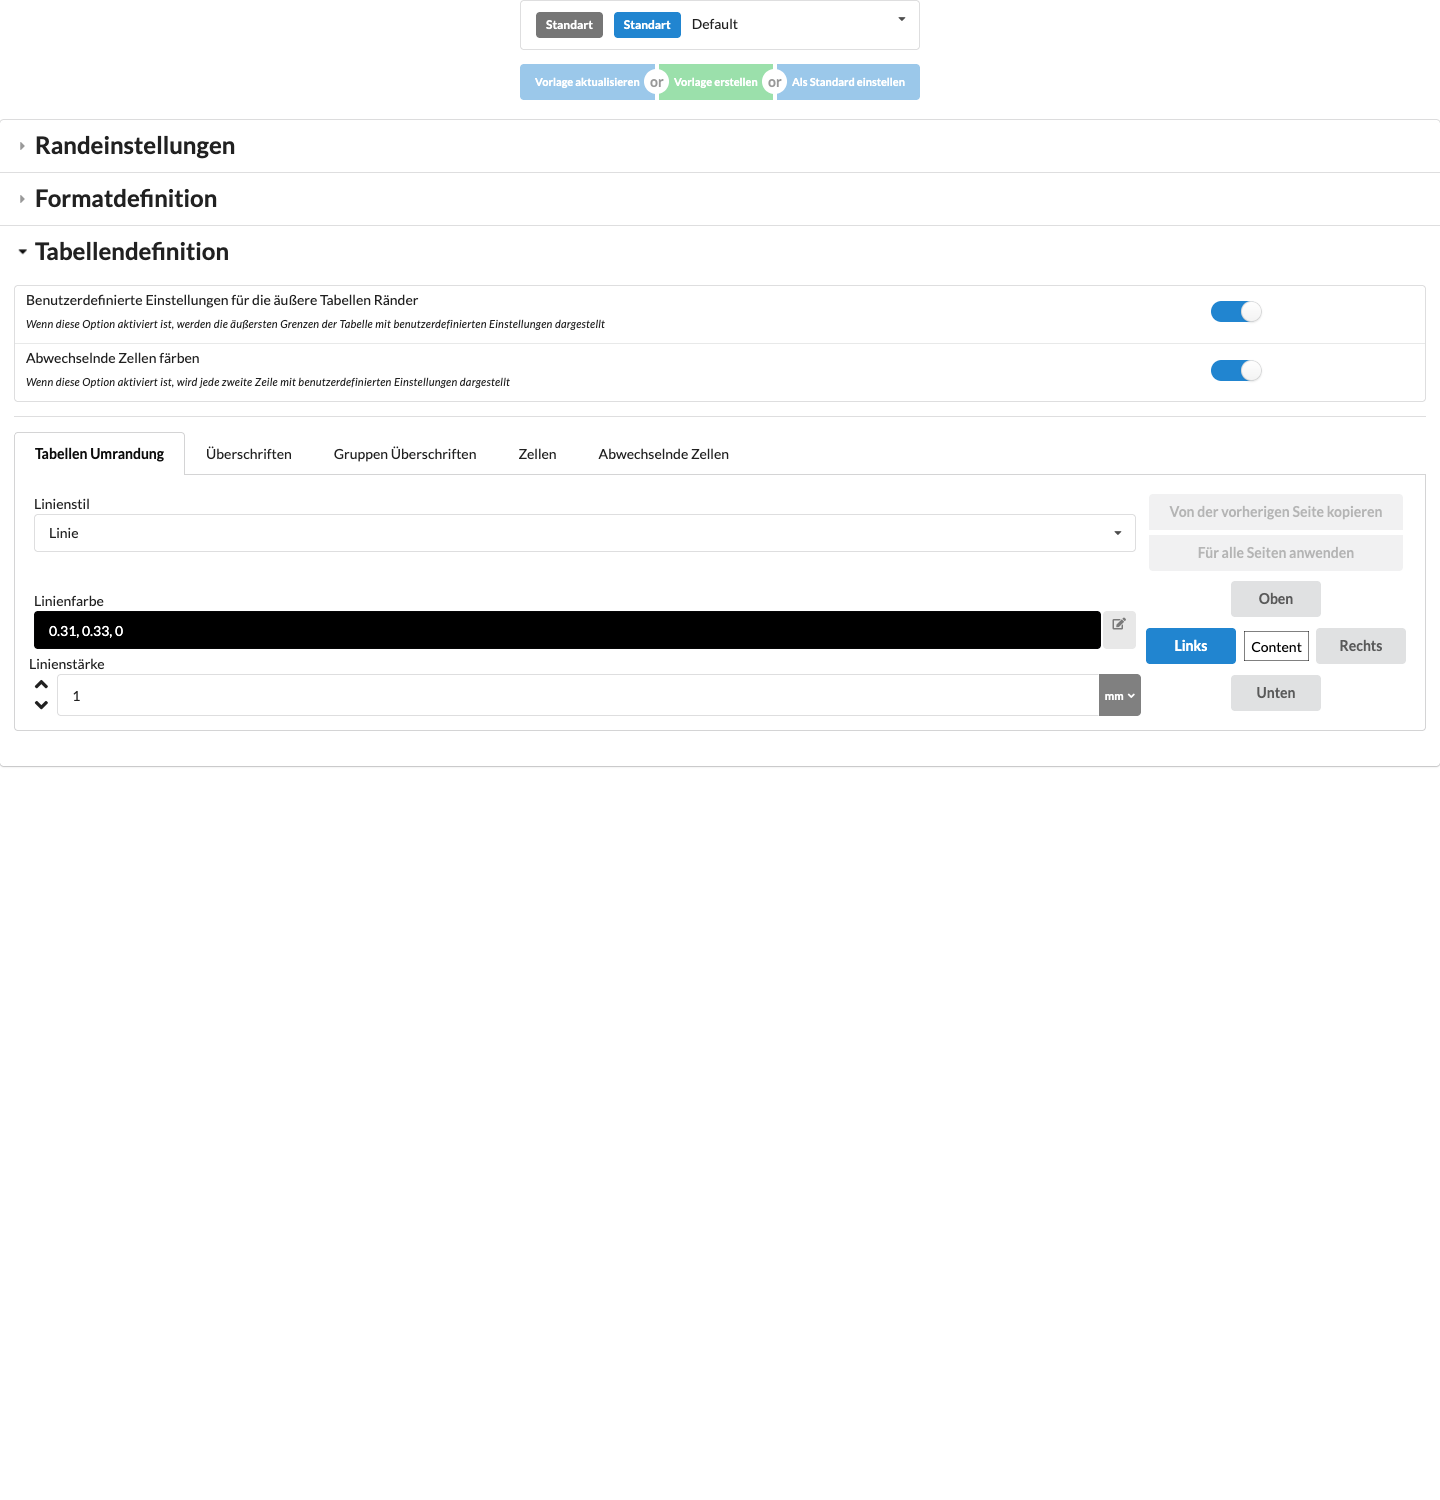
| Name | Description |
|---|---|
| Table Definition | Contains options for adjusting table borders, headings, and cell formatting. |
| Custom Settings for Outer Table Borders | Enables custom settings for the outer table borders. |
| Color Alternate Cells | Colors every other table cell using custom settings. |
| Table Border | Defines the outer and inner borders of the table. |
| Headers | Settings for table headings. |
| Group Headers | Formatting options for group headings in tables. |
| Cells | Adjusts cell colors, spacing, and border lines. |
| Alternate Cells | Configures colors and styles for alternating cell backgrounds. |
| Cell Color | Sets the background color of a cell. |
| Line Style | Sets the style of table lines (for example, solid or dashed). |
| Line Color | Sets the color of table lines. |
| Line Width | Sets the thickness of table lines. |
| Inner Spacing | Sets the spacing within a cell. |
| Copy from Previous Page | Uses the margin values saved before the last change for the selected cell side. The button becomes active only after a change. |
| Apply to All Pages | Applies the margin values saved before the last change to all four sides of the cell. The button becomes active only after a change. |
| Position (Top, Bottom, Left, Right, Content) | Top, Bottom, Left, and Right select the cell edge to edit. Content is a schematic view of the cell contents. |
| OK | Closes the format settings; the PDF is created only from the export dialog. |
The replaced example PDF contained 21 fixtures, a total weight of 437.603 kg, and one cue. These values describe only the example file. A printed QR code does not replace the access permissions required for the online project.
To export a table for further processing, first select Scene or an assembly sheet in the Worksheet Window, then select the desired list view. Click CSV and choose a filename and location in the save dialog. The CSV export uses the currently displayed table; the PDF layout, background, and QR code are not included in this file. In the Vectorworks context, VW Worksheet is also available to transfer the table to Vectorworks.
Use File → Export Worksheets as PDF... to assemble a multi-page document from your own text, montage sheets, and saved views. The command opens the Export Documentation dialog. This differs from the PDF button in the Worksheet Window, which exports the currently selected list view. You do not need a montage sheet to create documentation from text and views; to insert montage sheets or saved views, the corresponding content must be present in the drawing.
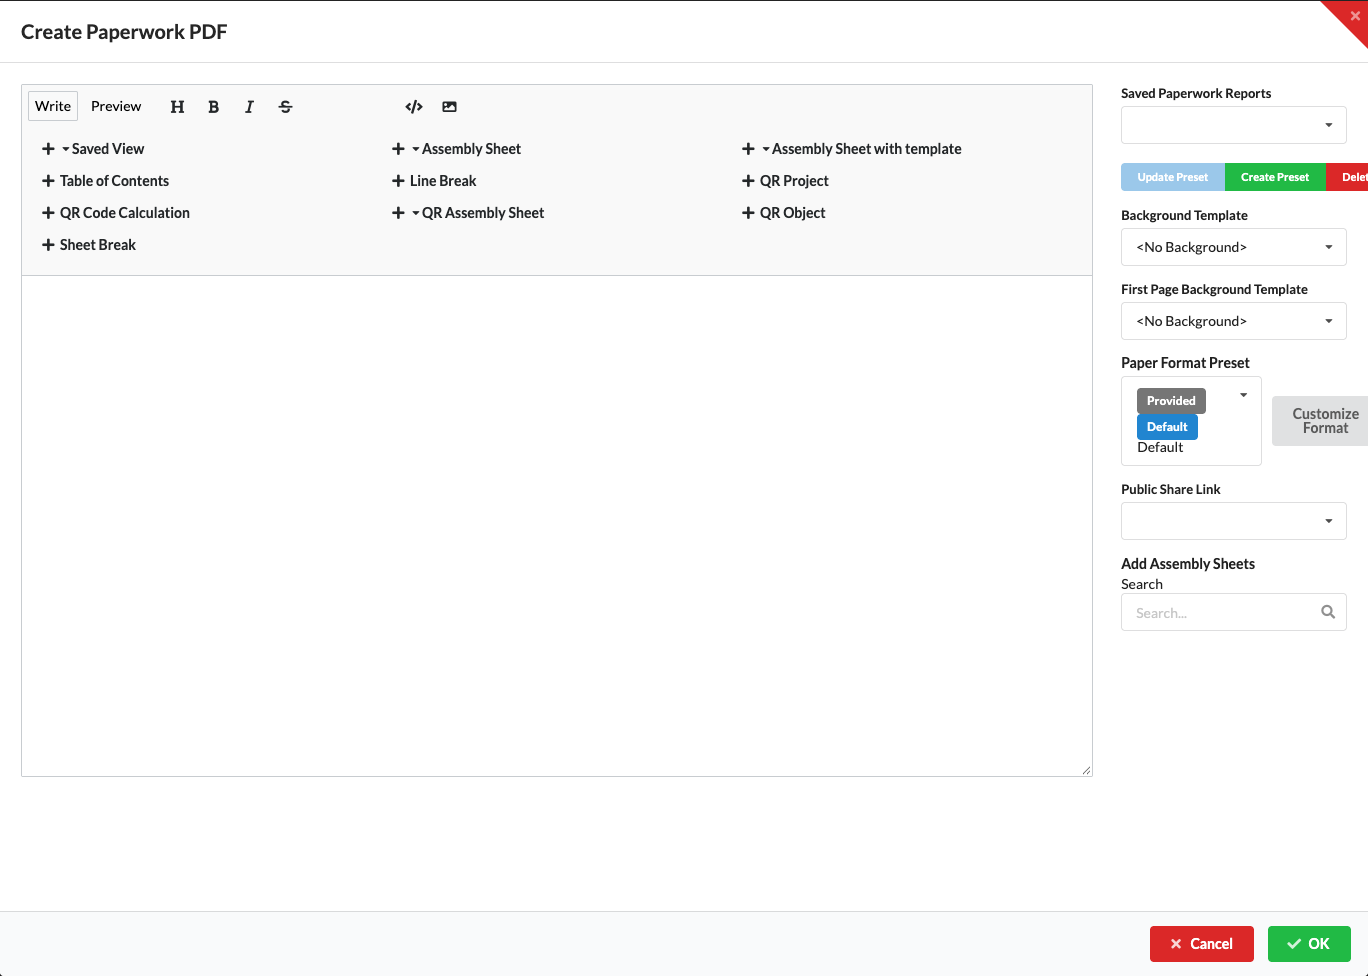
The screenshot shows the current dialog with an empty editor and synthetic sample data. The preview and the list of detected montage sheets depend on the contents of the open drawing.
The toolbar inserts placeholders such as %%WORKSHEET(Name)%% for a single montage sheet and %%SAVED_VIEW(Name, ,100,100,)%% for a saved view. Montage Sheets with Template inserts the sheets whose properties table uses the selected template. %%SHEETBREAK%% starts a new page; Line Break adds only a break in the text. If a named montage sheet or object cannot be found in the drawing, its content or QR code will not appear in the PDF. After renaming items, check the inserted placeholders.
Cancel does not create a PDF. If you edited the text, the dialog then offers Save Data or Discard Data: Save Data applies the current text and selected background labels to the drawing, while Discard Data closes without applying them. Save a documentation template separately with Create Template or Update Template.