

With load cells, you can display the forces actually measured at supports in Production Assist, compare them with the statically calculated forces, and optionally use them in a new static calculation. This lets you check whether the actual load distribution matches the model and whether the structure has sufficient capacity with the measured values as well.
Connecting to load cells and using their readings are Arena features in the desktop app. Open Rigging → Arena → Show Connected Load Cells.... To receive readings, a connection must be running and the cell ID must be entered for the corresponding support. T24 USB is supported only on Windows.
The Connect Load Cells dialog has a separate tab for each supported system. The required information differs by system:
| Connection | Required information and prerequisites |
|---|---|
| Broadweigh | Start the web server in the LOG100 software. Enter the IP address of the computer running LOG100, the port selected there, and a suitable update rate. Both computers must be connected over a reachable network. You can add multiple LOG100 systems. |
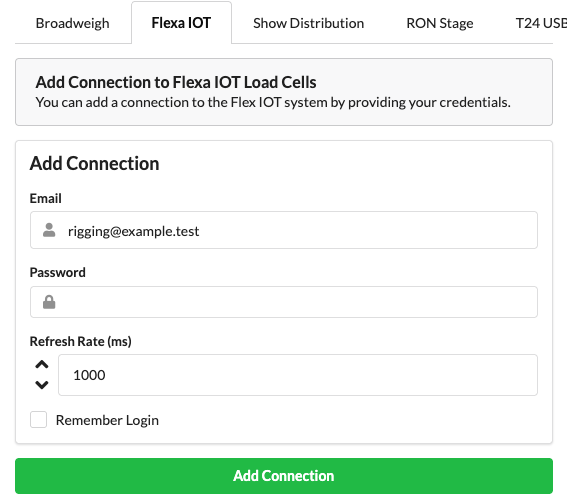
| Flexa IOT | Enter the email address and password for the Flexa IOT account, along with the update rate. Save Login remembers the credentials. |
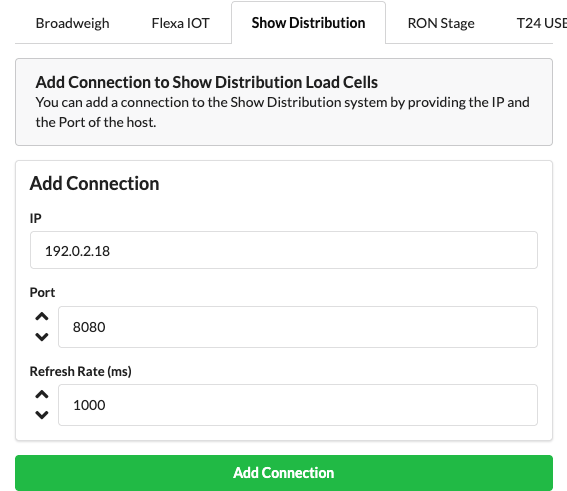
| Show Distribution | Enter the host IP address and port, along with the update rate. |
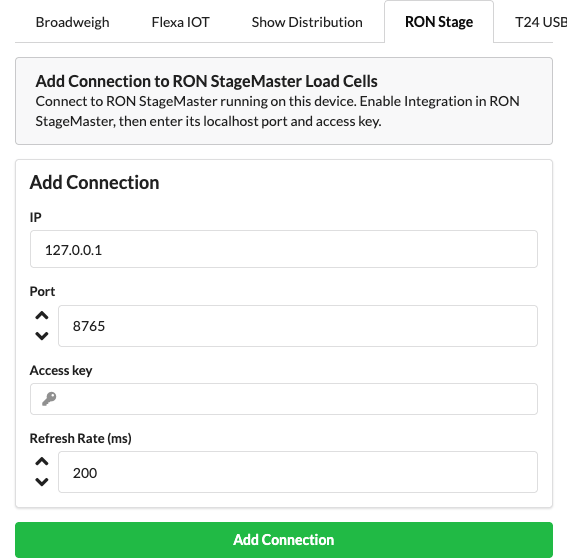
| RON Stage | Connect to the local RON StageMaster service. First enable the integration in RON StageMaster, then enter the host IP, port, access key, and update rate. If StageMaster runs on the same computer, the local host address is 127.0.0.1. |
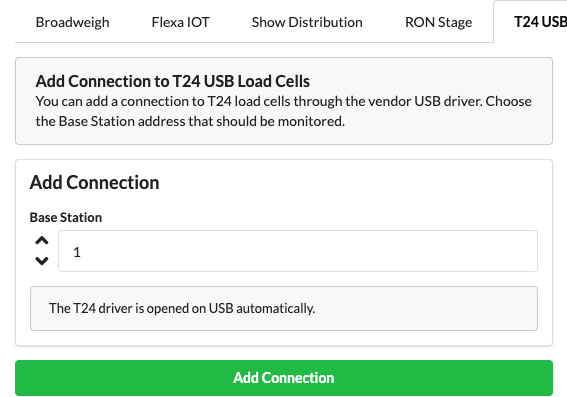
| T24 USB | Select the base station. Production Assist opens the T24 driver over USB; the form does not ask for an update rate. The base station and USB hardware must be available on the Windows computer. |
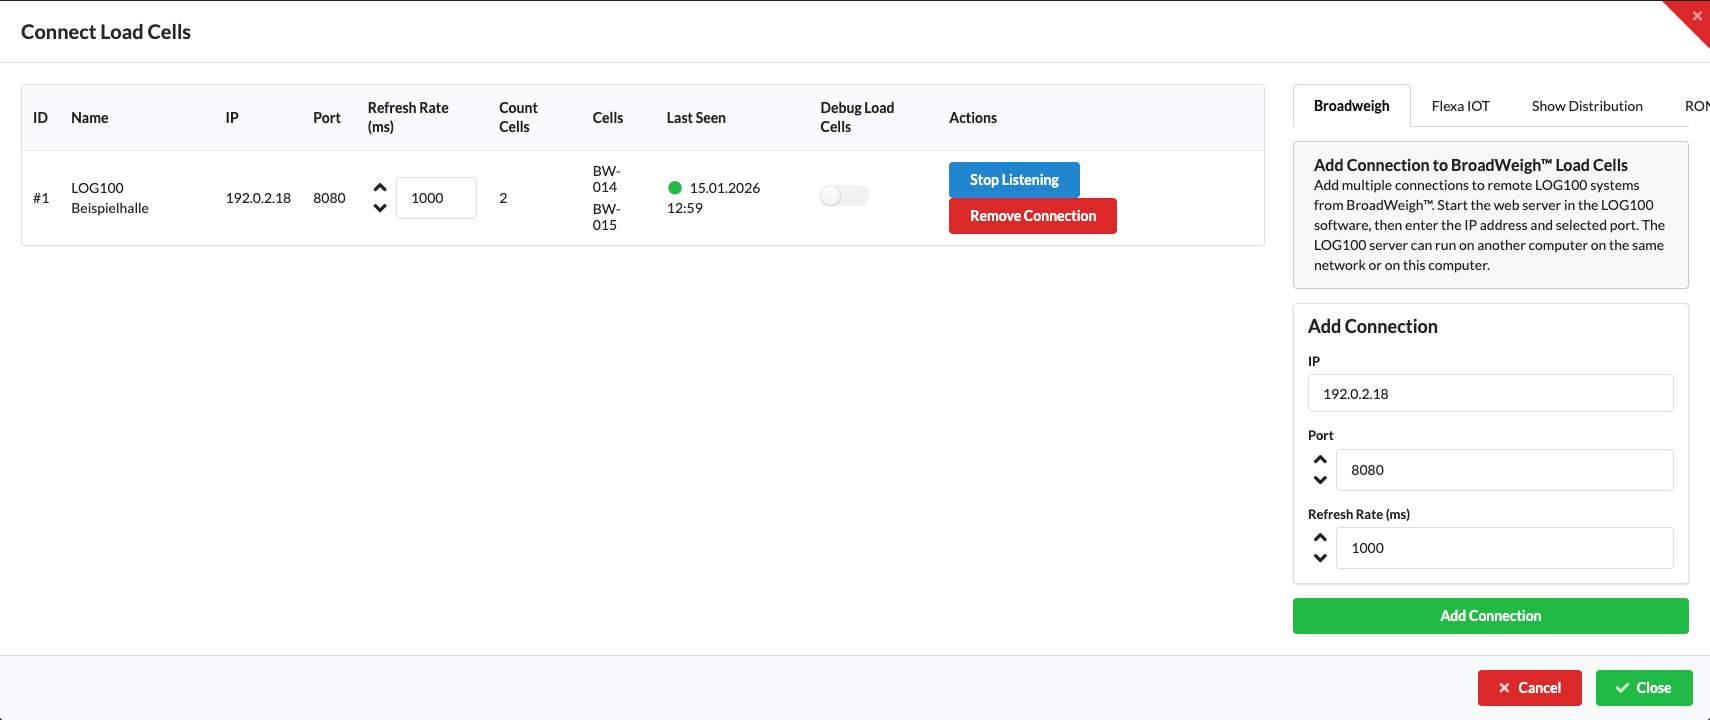
The example connection shows a synthetic LOG100 address and sample data. The address 192.0.2.18, the port, and the cell IDs are not real device details. In the form on the right, you can add a connection of the selected type; configured connections appear in the table on the left.
The following screenshots show additional form fields for the other connection types. All logins, addresses, and measurements shown are sample data.
LOG100 is external measurement software and is not rendered by Production Assist. The following manufacturer screenshots show examples of where to configure the LOG100 web server and its port; the interface may vary by LOG100 version.


| Column or action | Description |
|---|---|
| ID, Name, IP, Port | Identify the connection and its endpoint. T24 shows USB instead of an IP address; its port column shows the base station, status, channel, revision, and group-key status. |
| Update Rate (ms) | The column shows the polling interval and can be changed in the connection table. Adjust it to match the device configuration and measurement requirements. The table also shows this general column for T24; the T24 form for adding a connection does not ask for a value. |
| Number of Load Cells, Cells | Show the devices most recently detected and their IDs. A cell remaining in the list does not prove that it is currently reachable. |
| Last Seen | Shows when Production Assist last processed a changed measurement. If the values are stable, the displayed time may be older even though the connection is still running. The status indicator is also not a reliable freshness check; for T24, the separate status indicator shows the connection to the base station. |
| Debug Load Cells | Generates sample data for Broadweigh LOG100 instead of querying the LOG100 web server. Do not use this function to check real measurements or for calculations with real measurement data. |
| Start Listening / Stop Listening | Starts or stops receiving data for the connection. |
| Remove Connection | Removes the connection from the current drawing. |
If no data arrives, check the network, device server, port, credentials or access key, and monitoring status. Read Last Seen together with the connection status; when measurements have not changed, the timestamp does not need to update with every poll.
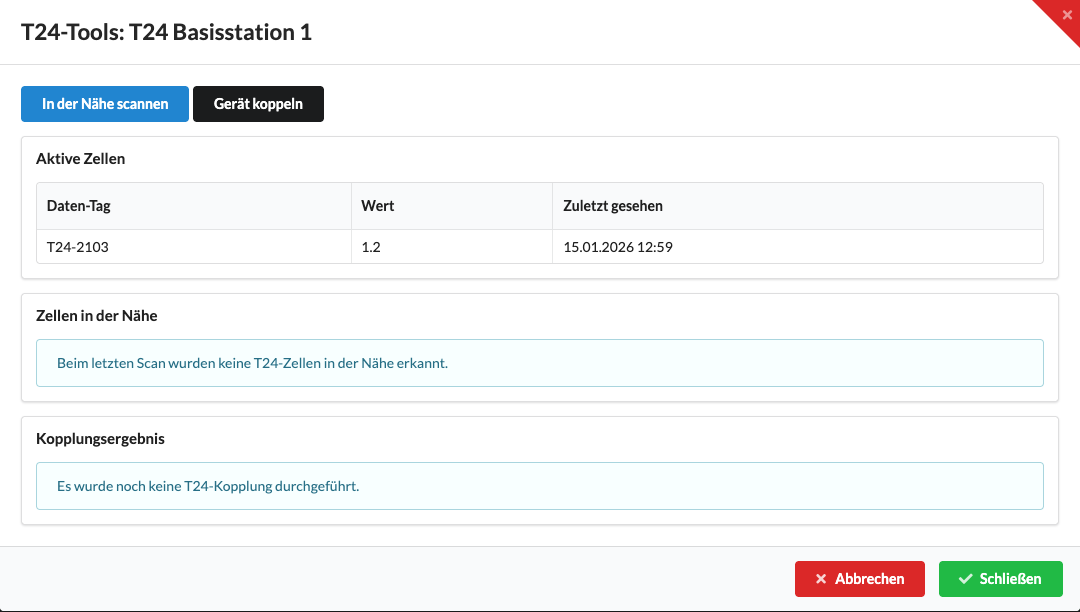
For T24 USB, the connection must be running and the base station must show as connected. Open T24 Tools in the T24 row.
The scan and pairing actions are disabled when the connection or base station is not ready.
Open the connection's spectrum analyzer with Spectrum. If the T24 connection is stopped, the dialog displays a note and disables Start Spectrum. If the connection is active but the base station is disconnected, the start button remains enabled; connect the base station first so spectrum data can arrive. The graph shows the sample on the X axis and the signal in dB on the Y axis. If no spectrum data is available yet, start the analysis and wait for the next update.
Each load cell must be assigned to the support where it physically measures force. Make the assignment in the Support section of Object Properties:
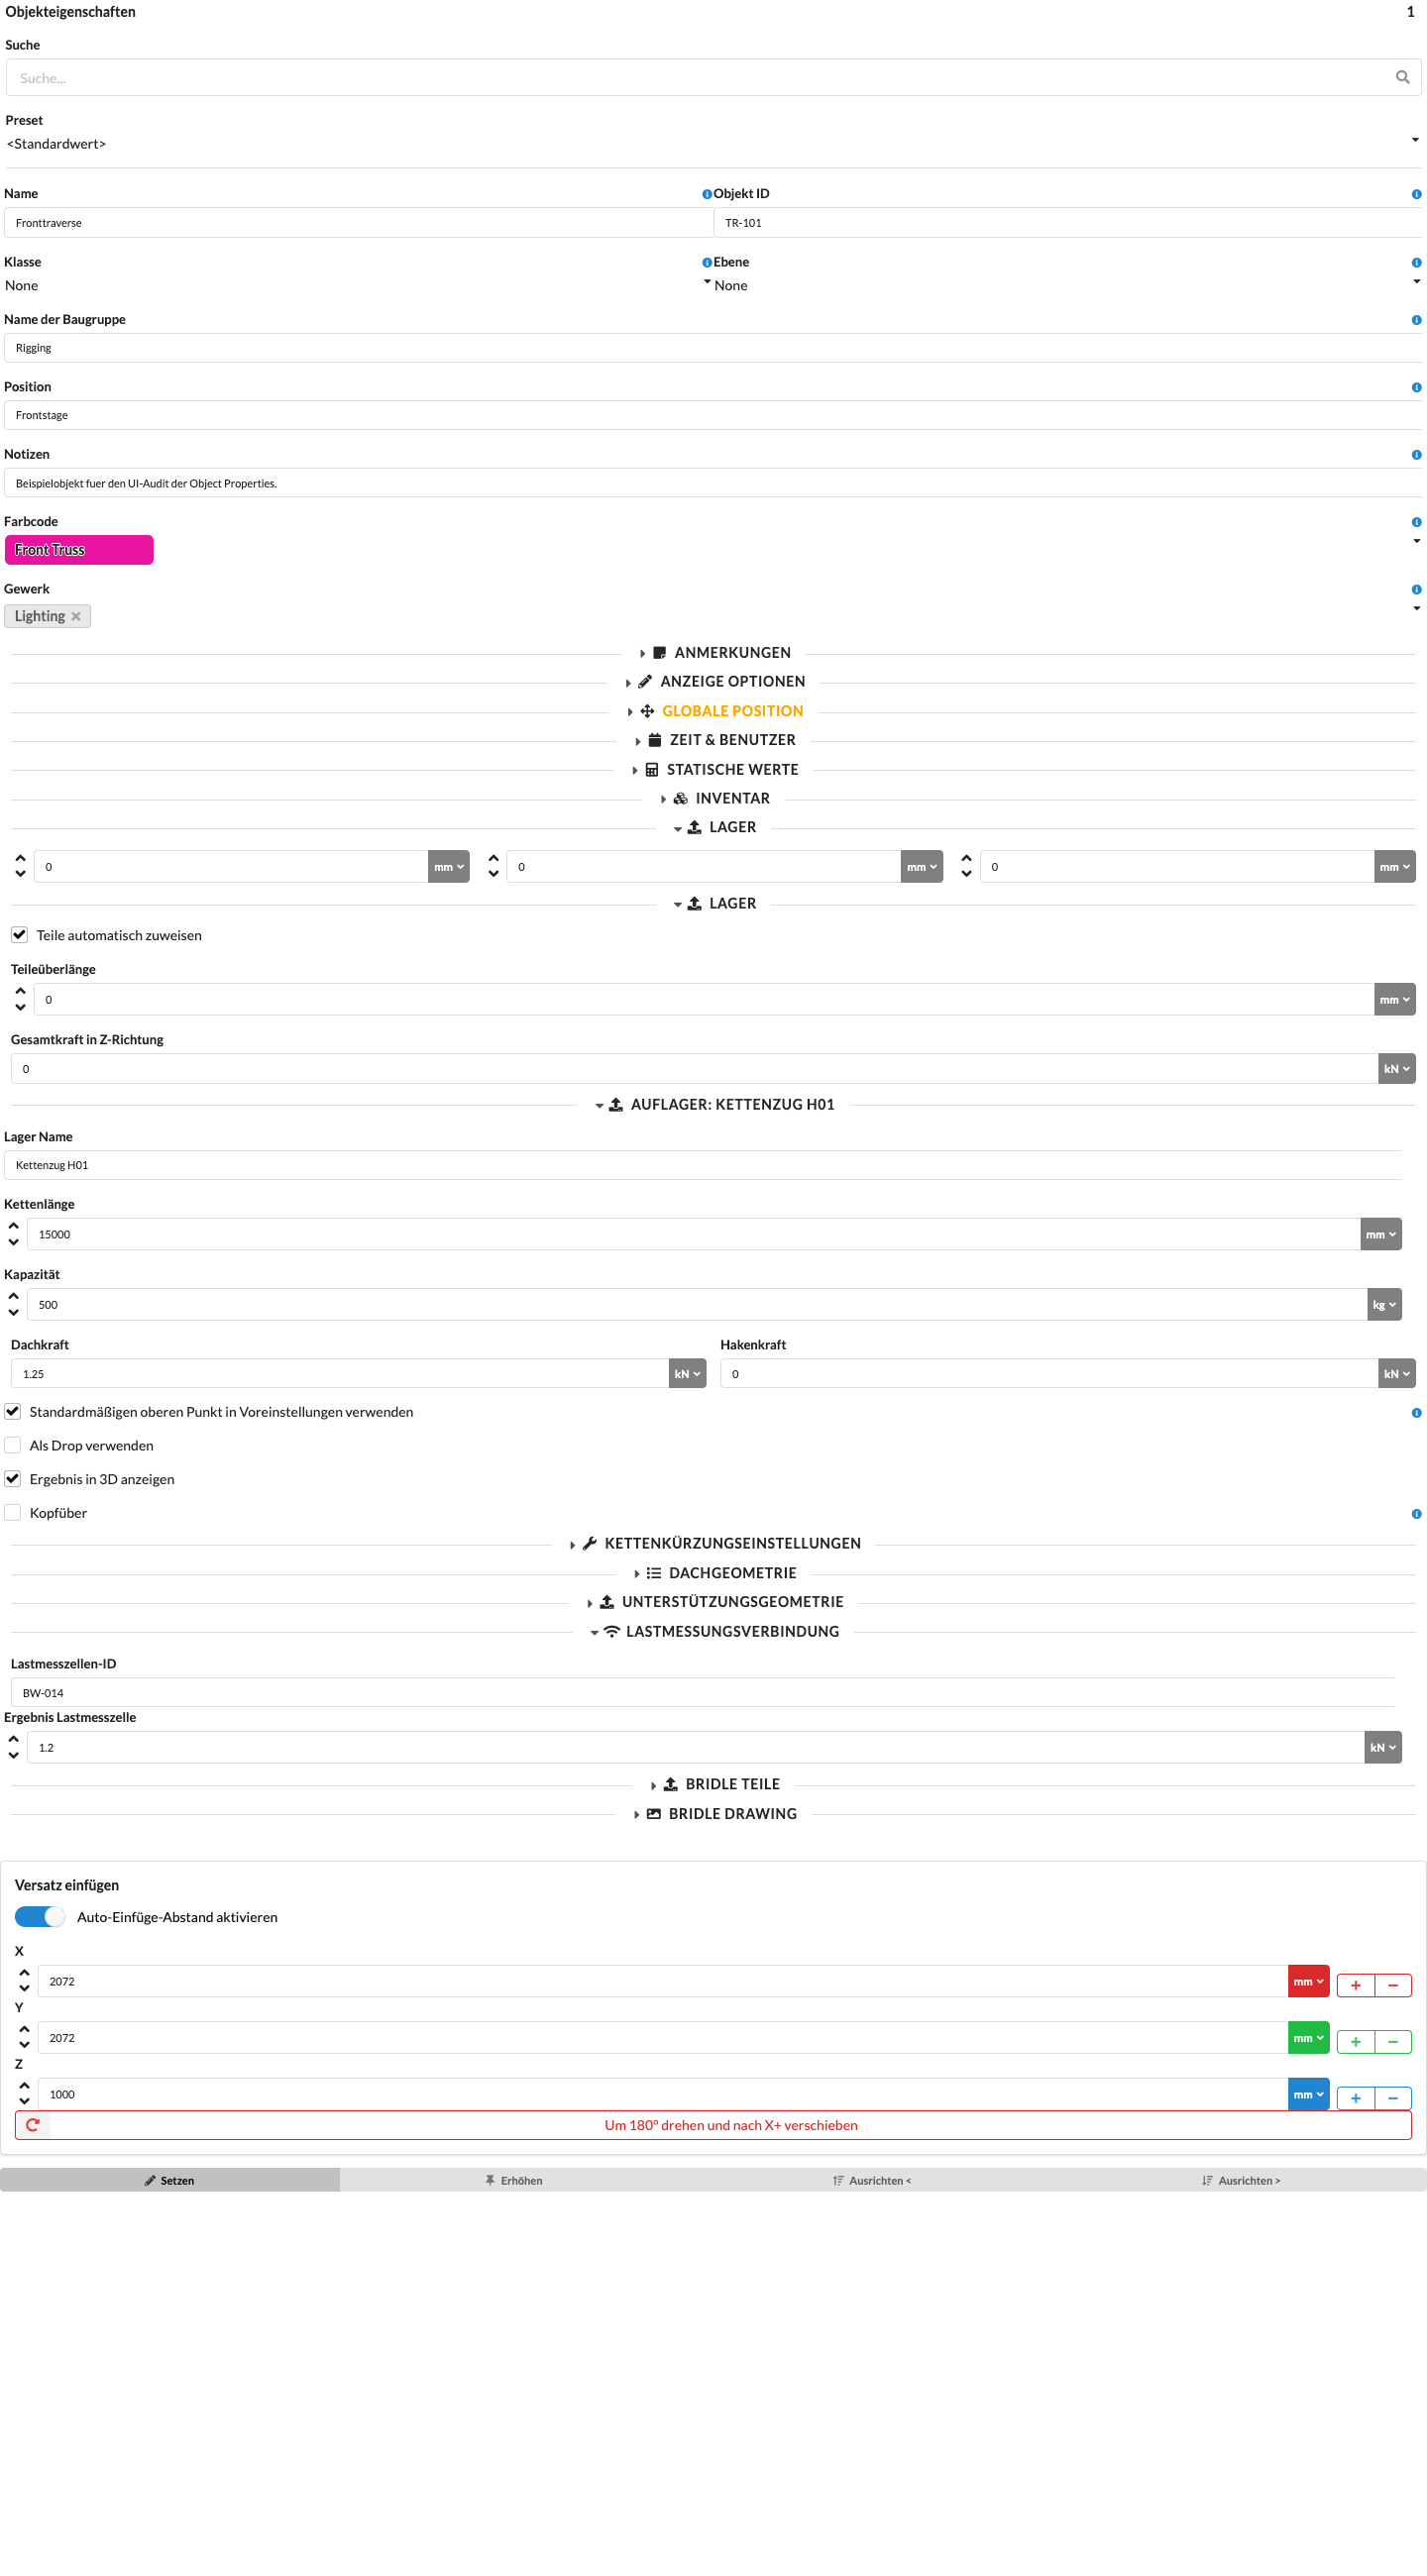
The ID BW-014 and the displayed measurement are synthetic sample data. A matching ID assigns the received measurement to that support. If you enter the cell ID for the wrong support, or if it does not match the received ID, Production Assist will not compare the intended measurement point.
For more information about support properties, see Support in Object Properties.
A Selection Group can combine the supports for a measurement point, stage, or assembly. Select the support objects and save the selection with Add New Selection Group or the disk icon in an existing group. The group then shows the sum of the calculated and measured forces at its supports.
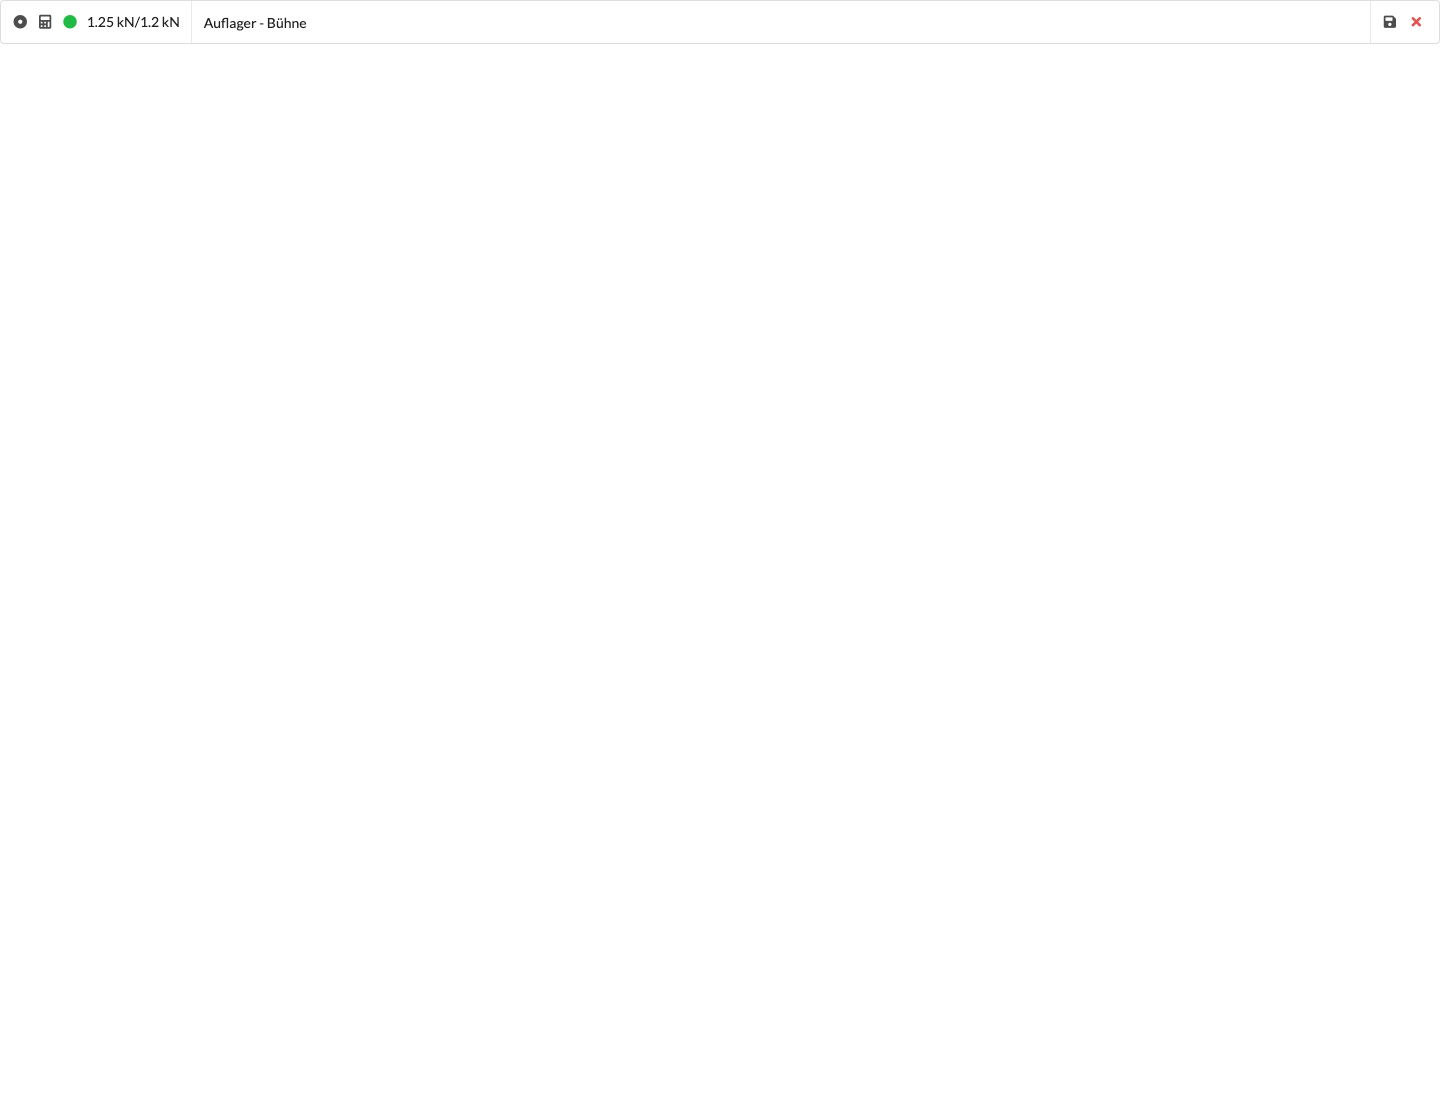
The synthetic sample values differ by 4 percent and are therefore marked green. The status indicator compares the magnitudes of the two sums: a deviation of less than 5 percent is green, exactly 5 percent is yellow, and more than 5 percent is red. The percentage deviation is relative to the larger of the two magnitudes. A green indicator without valid measurements does not confirm a successful measurement.
The selection group stores a list of objects. Creating one does not change the calculation scope. The calculator icon in the group row selects the group objects and sets them as calculation objects. For details on creating and editing groups, see Selection Groups in Navigation.
If the values do not match, check:
For tabular output, use the Hoist Load Cells and Measured Load Overview worksheets. Hoist Load Cells shows the support ID, measurement, calculated roof force, and chain shortening. Measured Load Overview compares measured and calculated loads for each object and can be filtered by assemblies. Check the included objects and measurements before sharing the output.
Displaying a measurement alone does not change the calculation. To calculate with the actual load state, enable Use Load Measurement for Calculation in the Settings profile under Load Combination Settings → Working Load Calculation Settings.
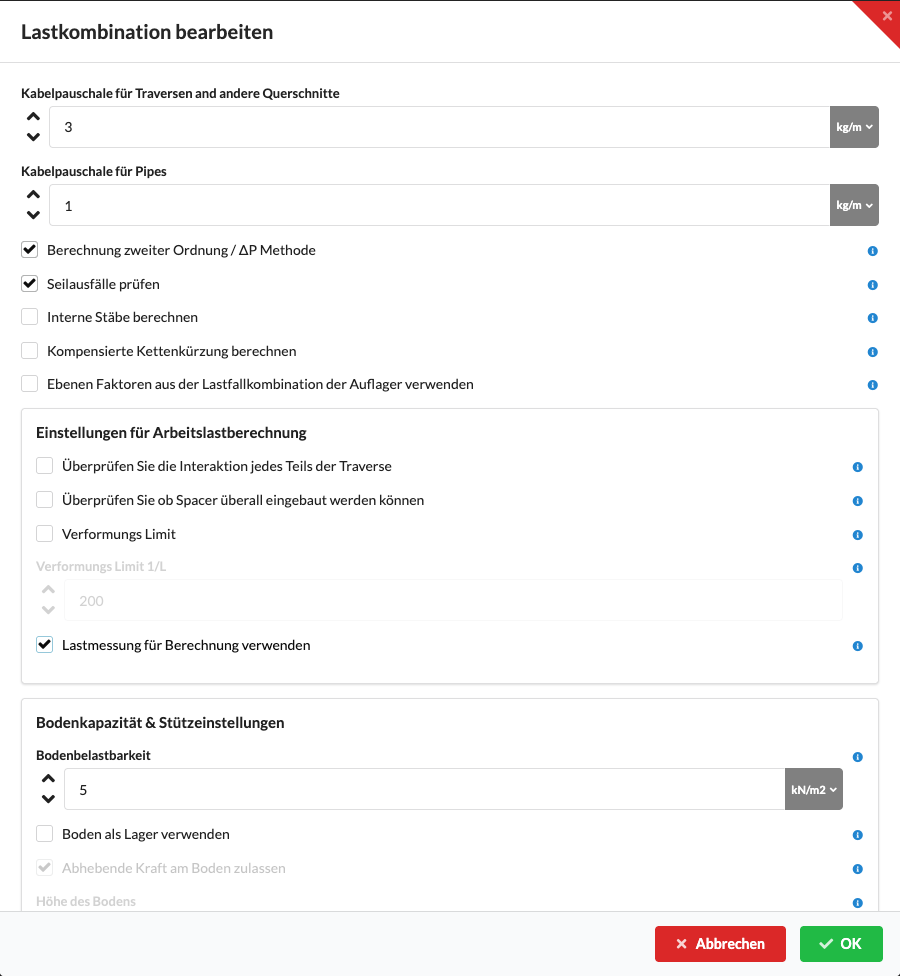
When the calculation runs, Production Assist first calculates the support forces for the active support load combination. For each assigned support, the application compares this calculated value with the measured value. It applies the difference as an additional force to the connected structure or rope, then calculates the system using this measured load state. The other drawn loads remain part of the model.
The measurement therefore does not simply replace all loads in the drawing. It corrects the force at the assigned support relative to the original calculated force. Production Assist cannot make this correction without a running connection, a matching cell ID entry, and a current measurement. The setting and its effect on the static calculation are also described in Use Load Measurement in the Calculation.
If the problem persists, note the measurement system, connection status, cell ID, and Last Seen for support.